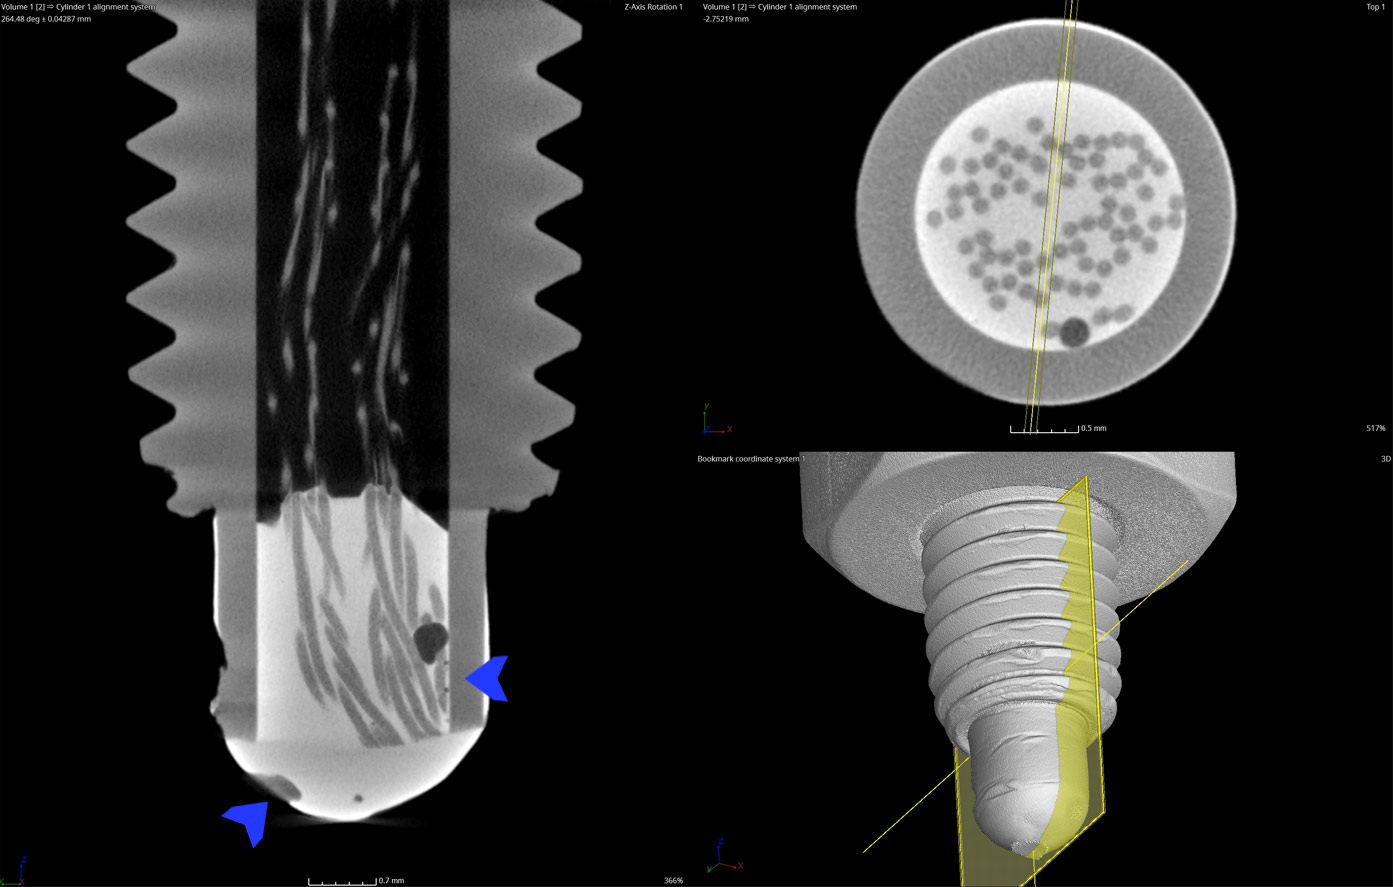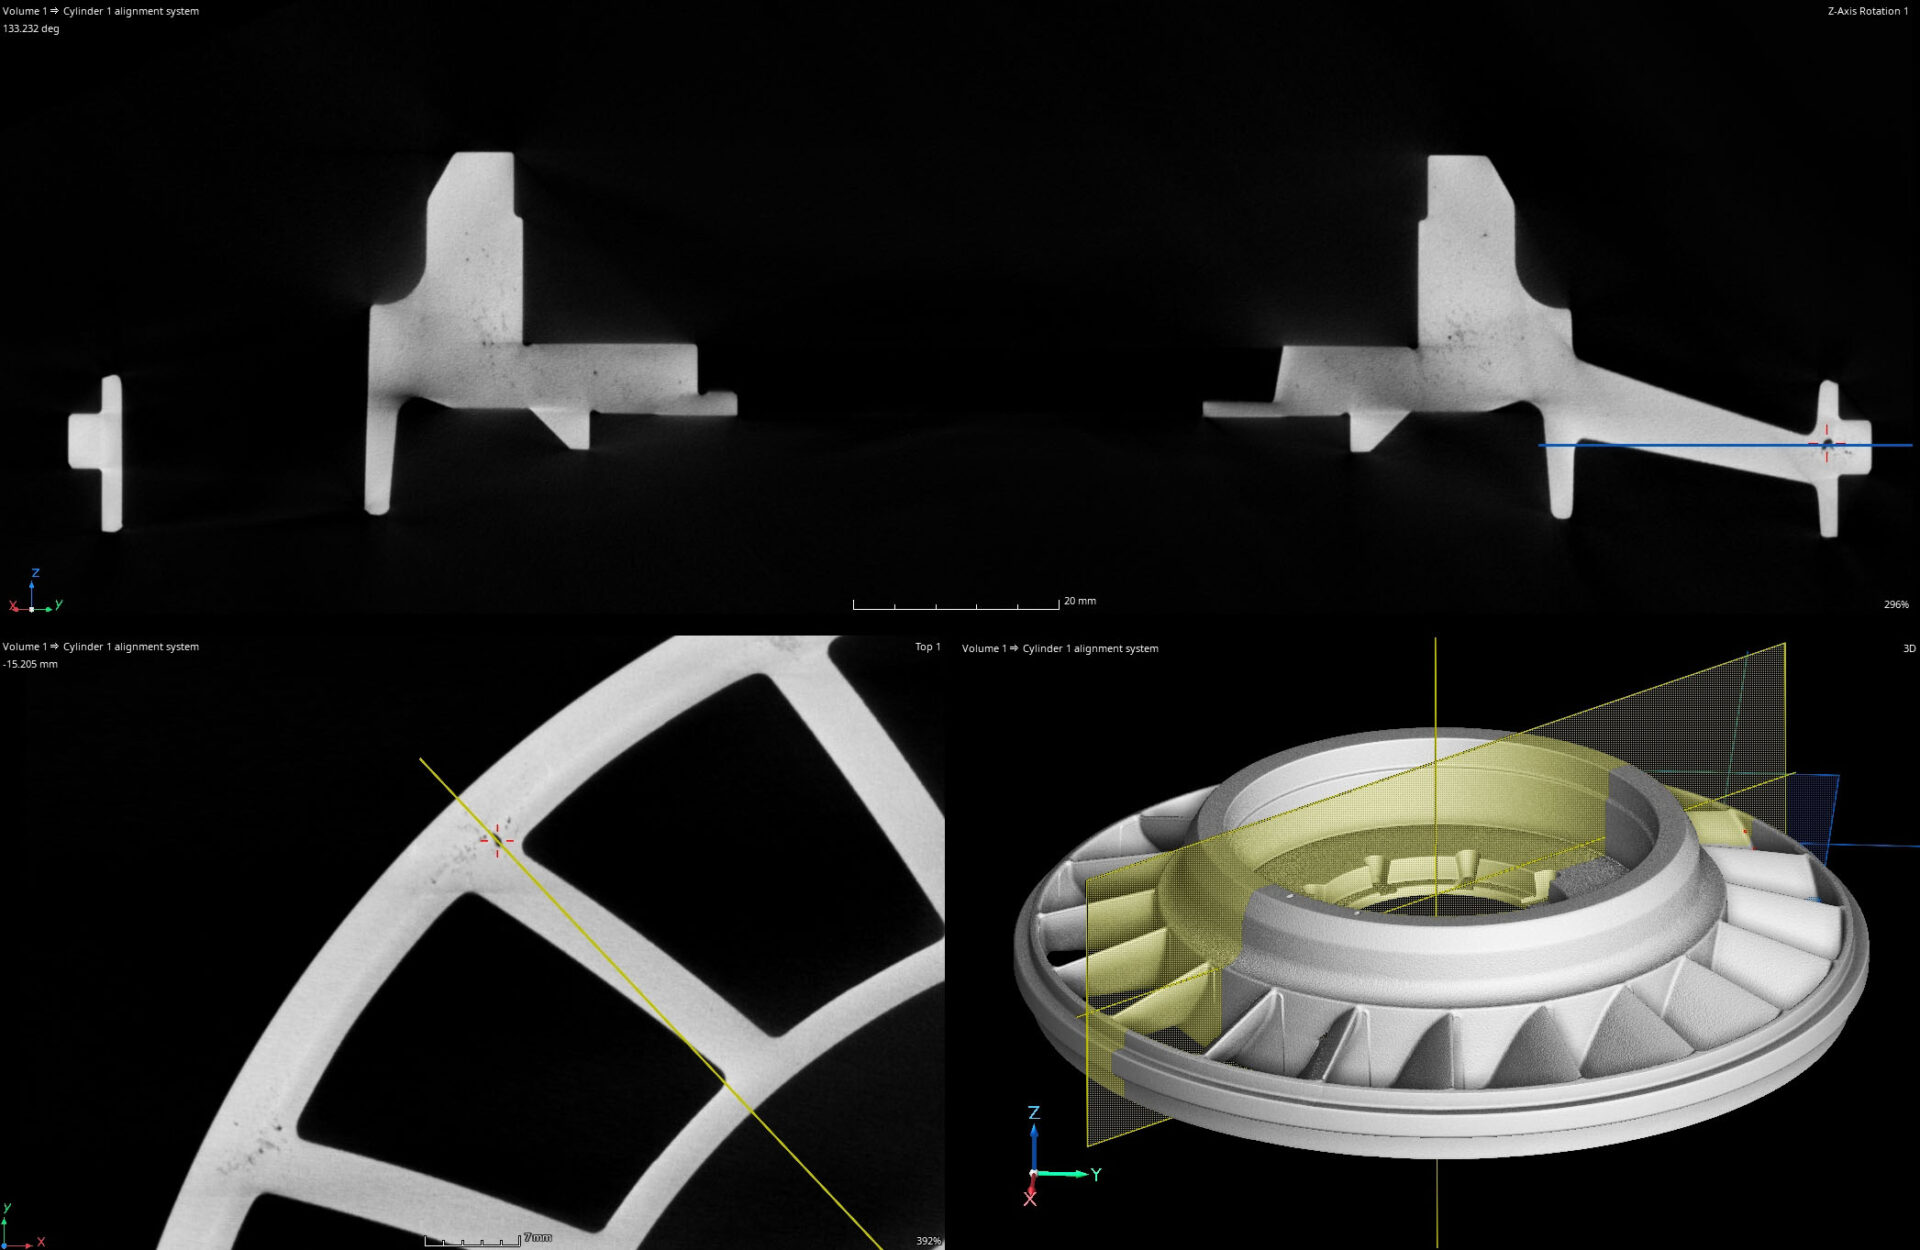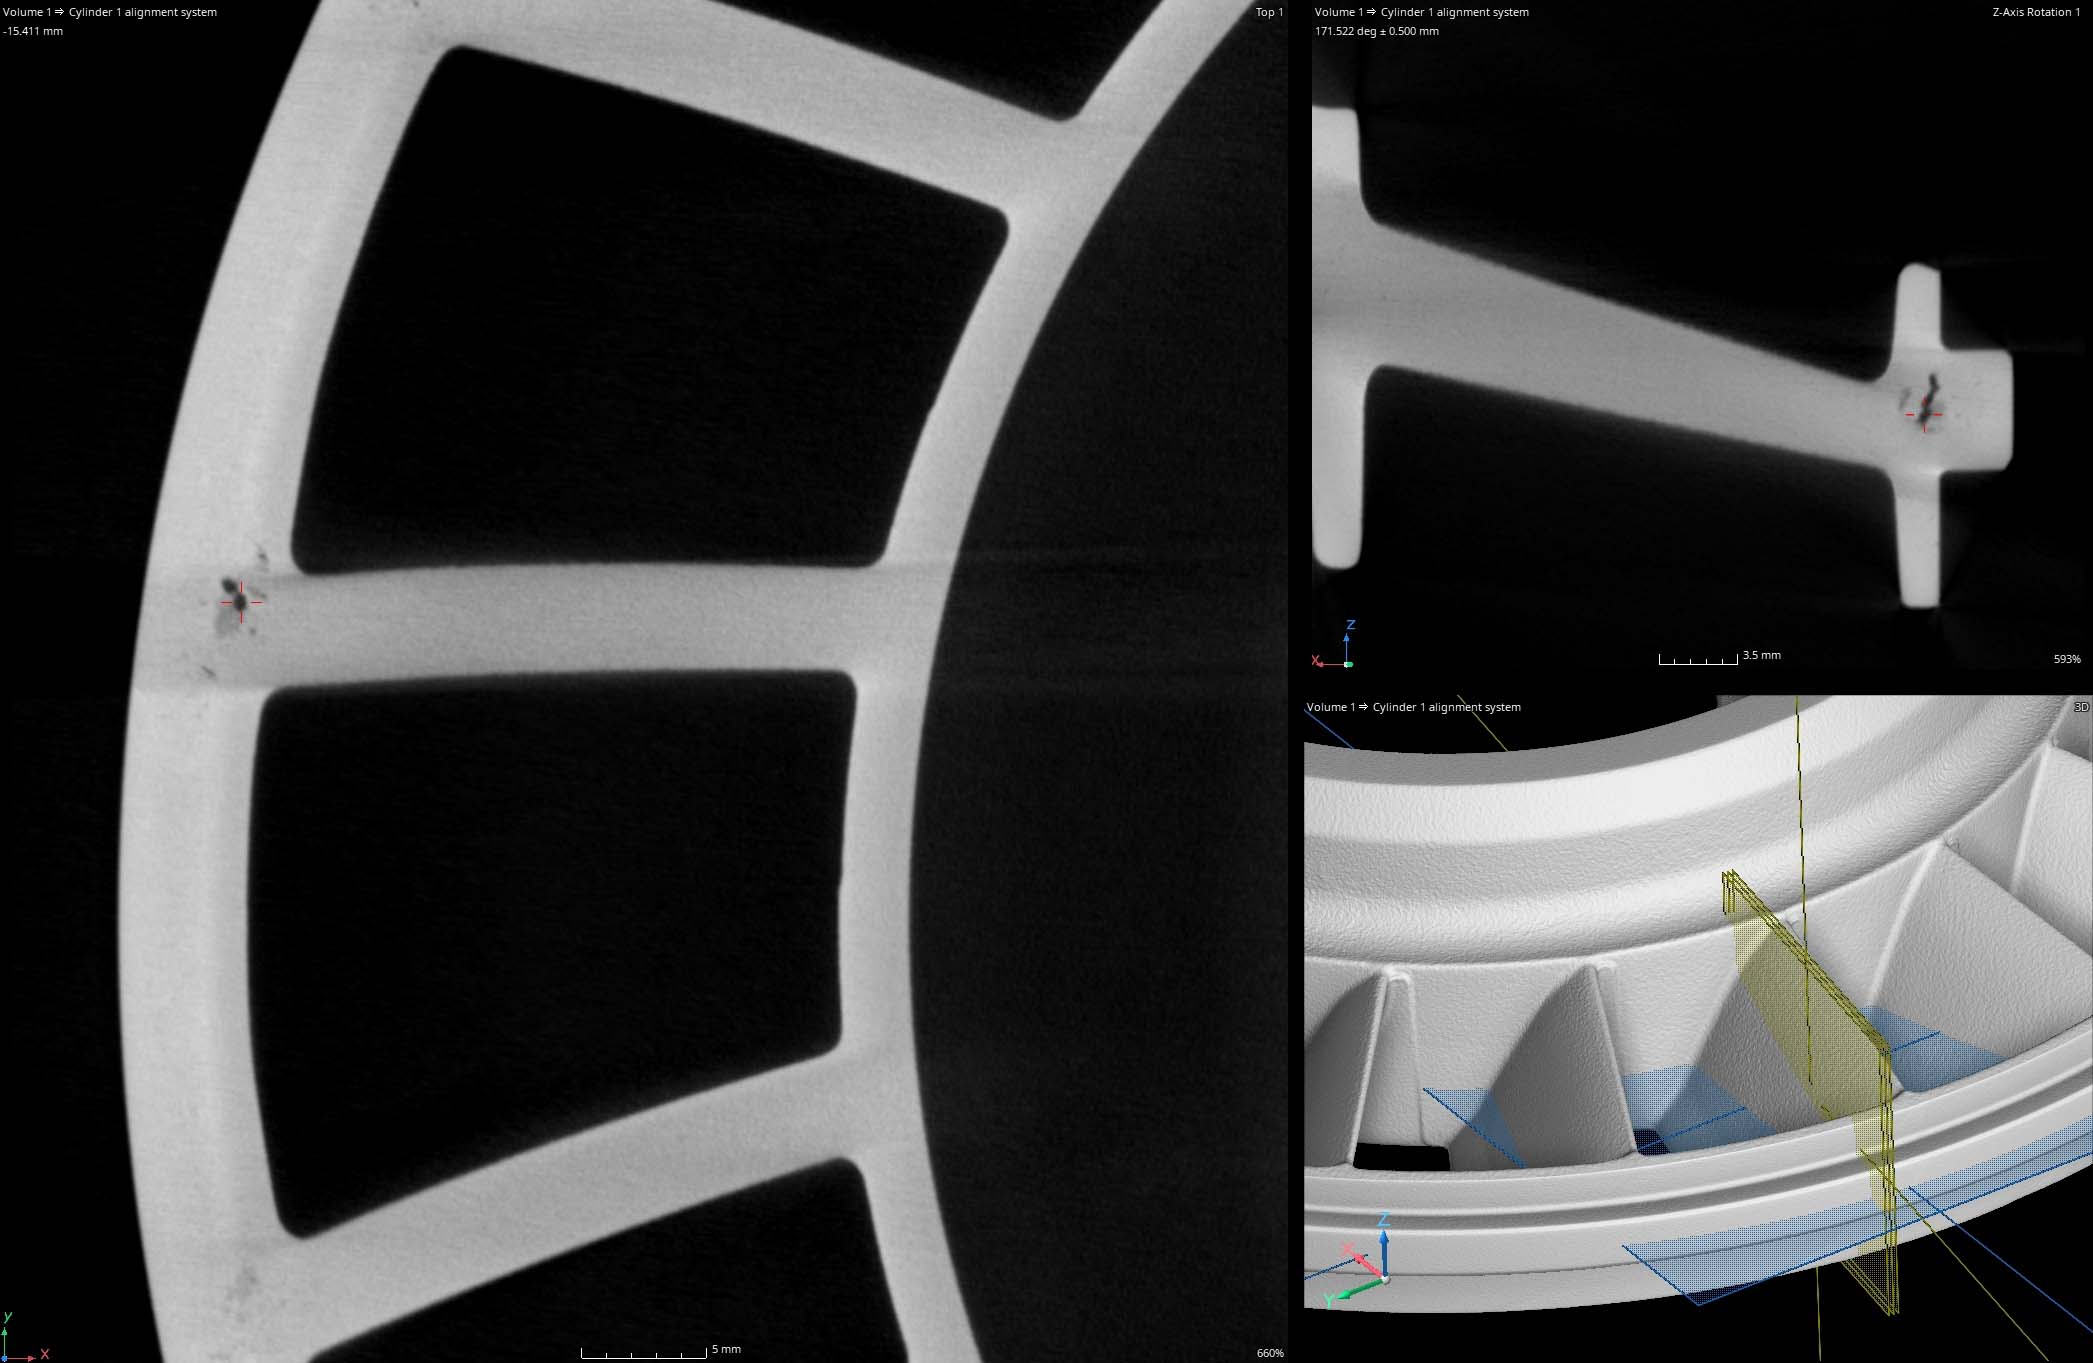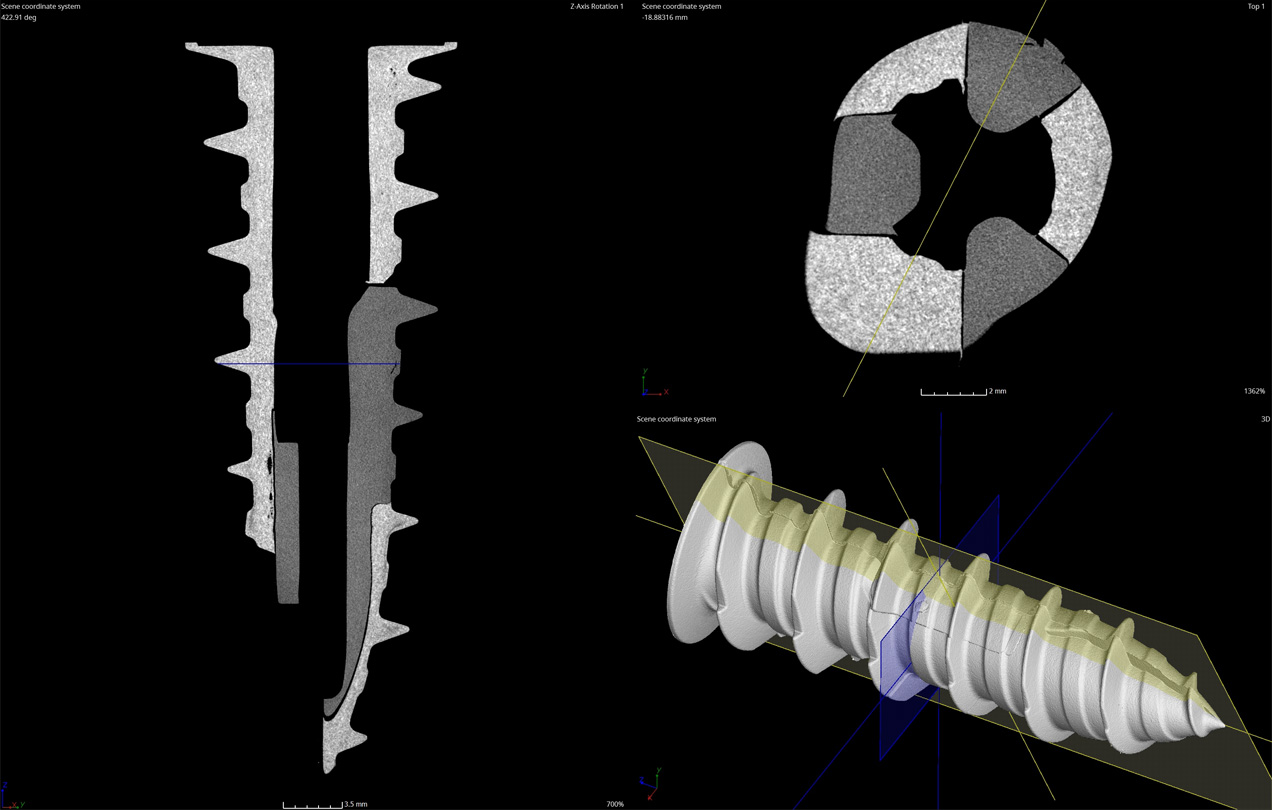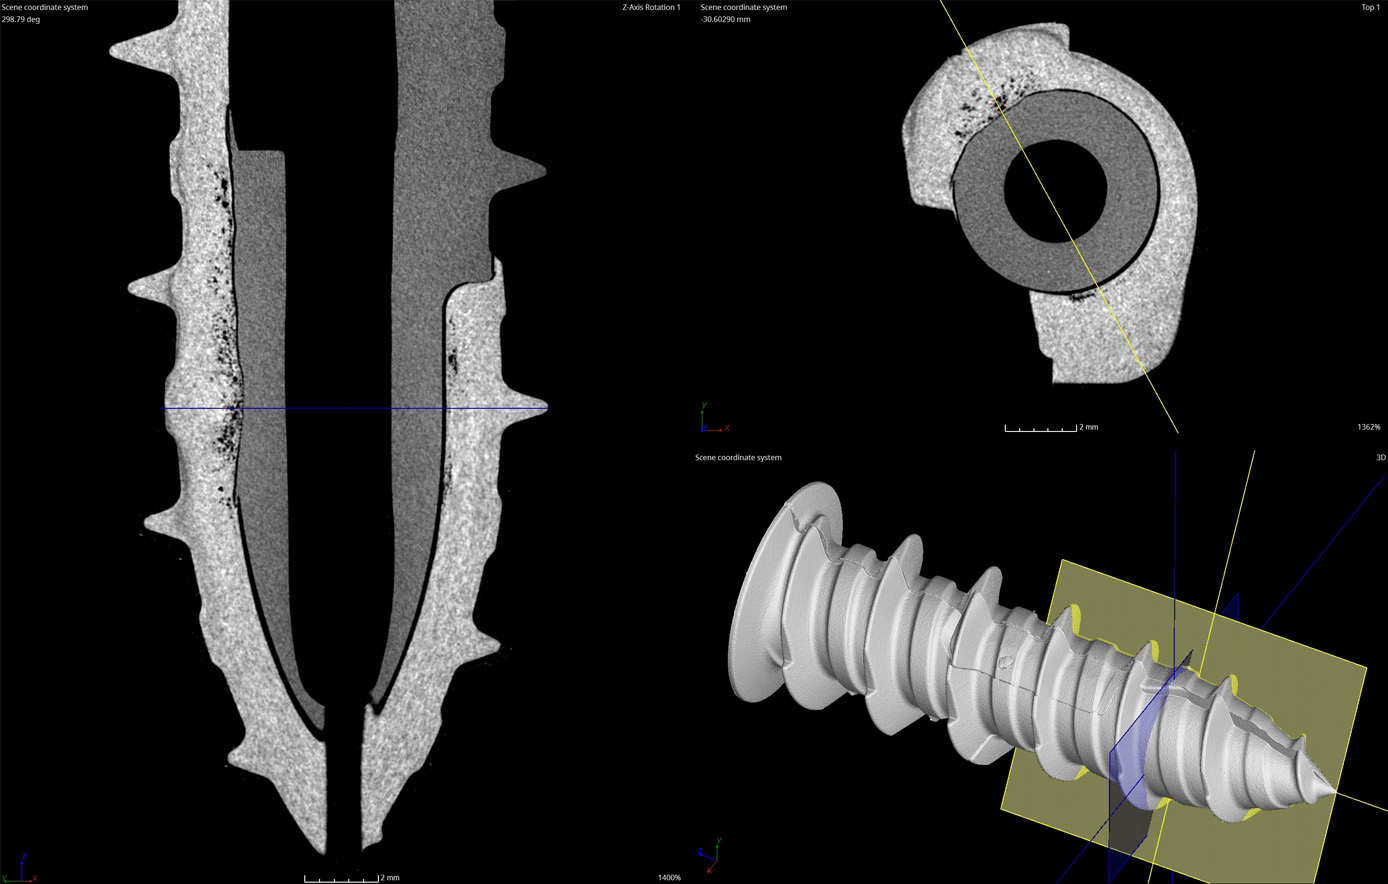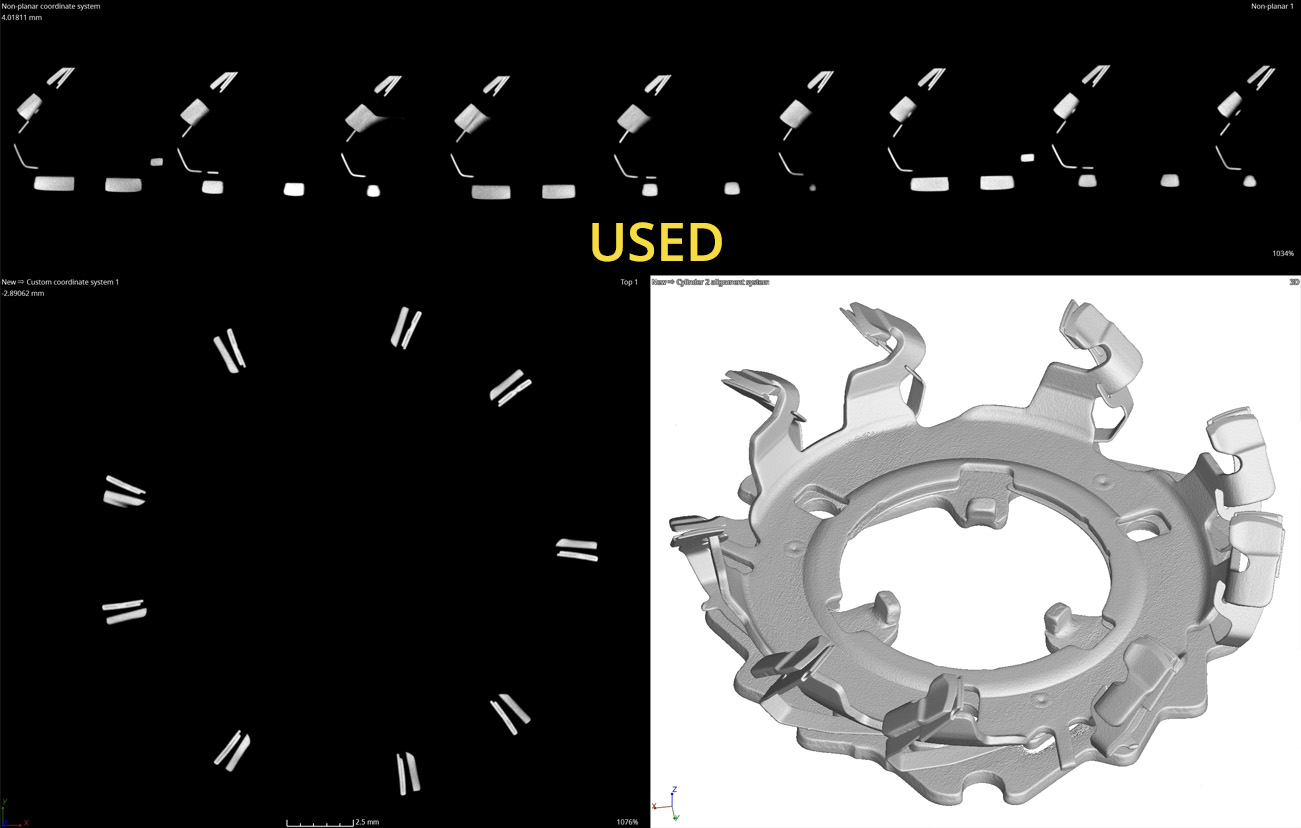

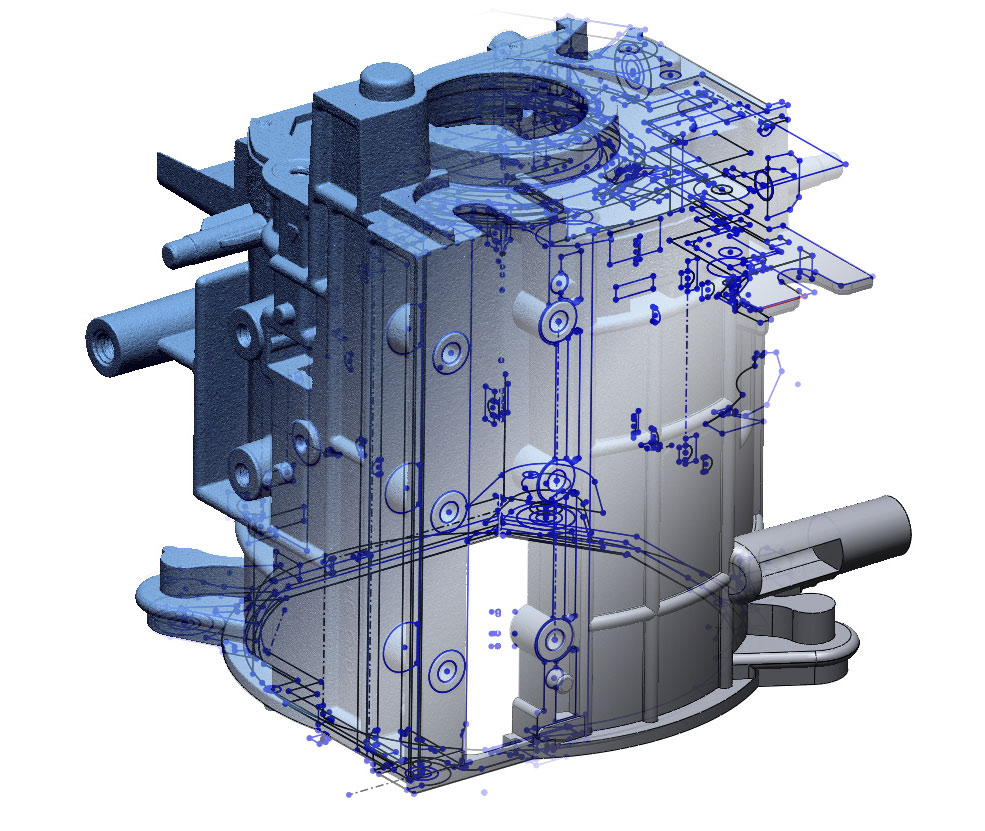
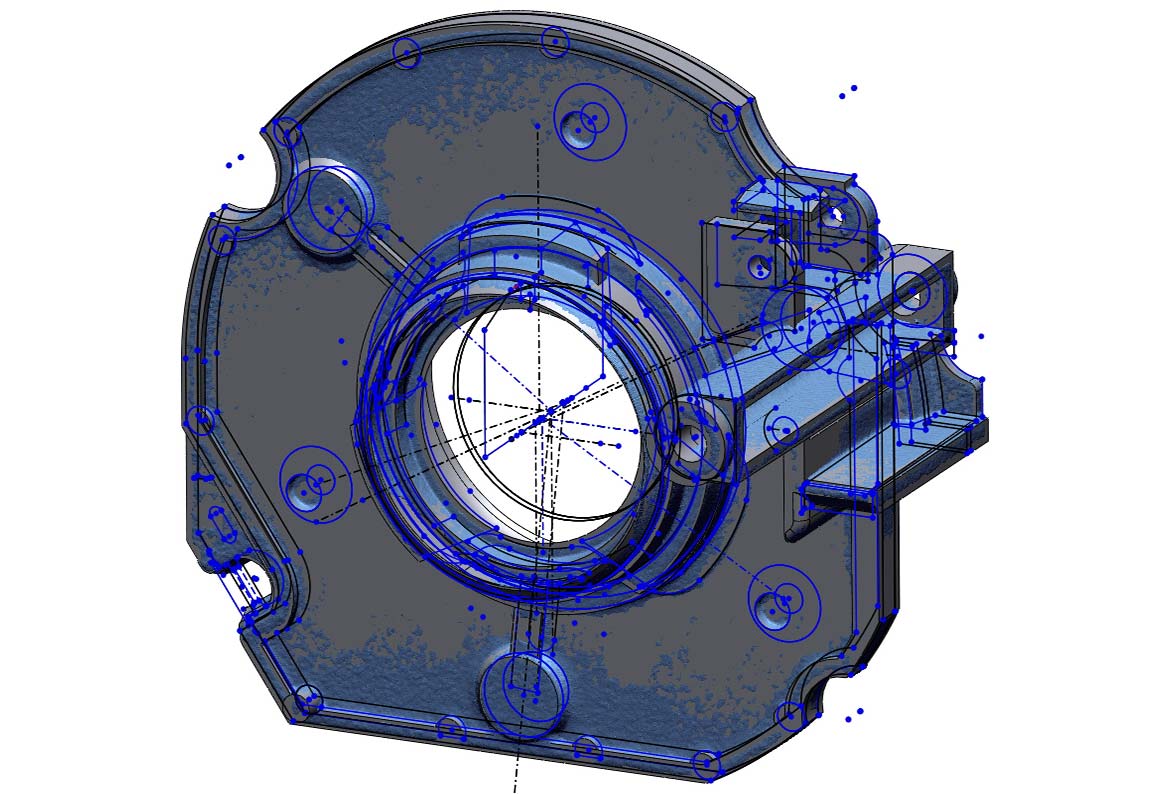
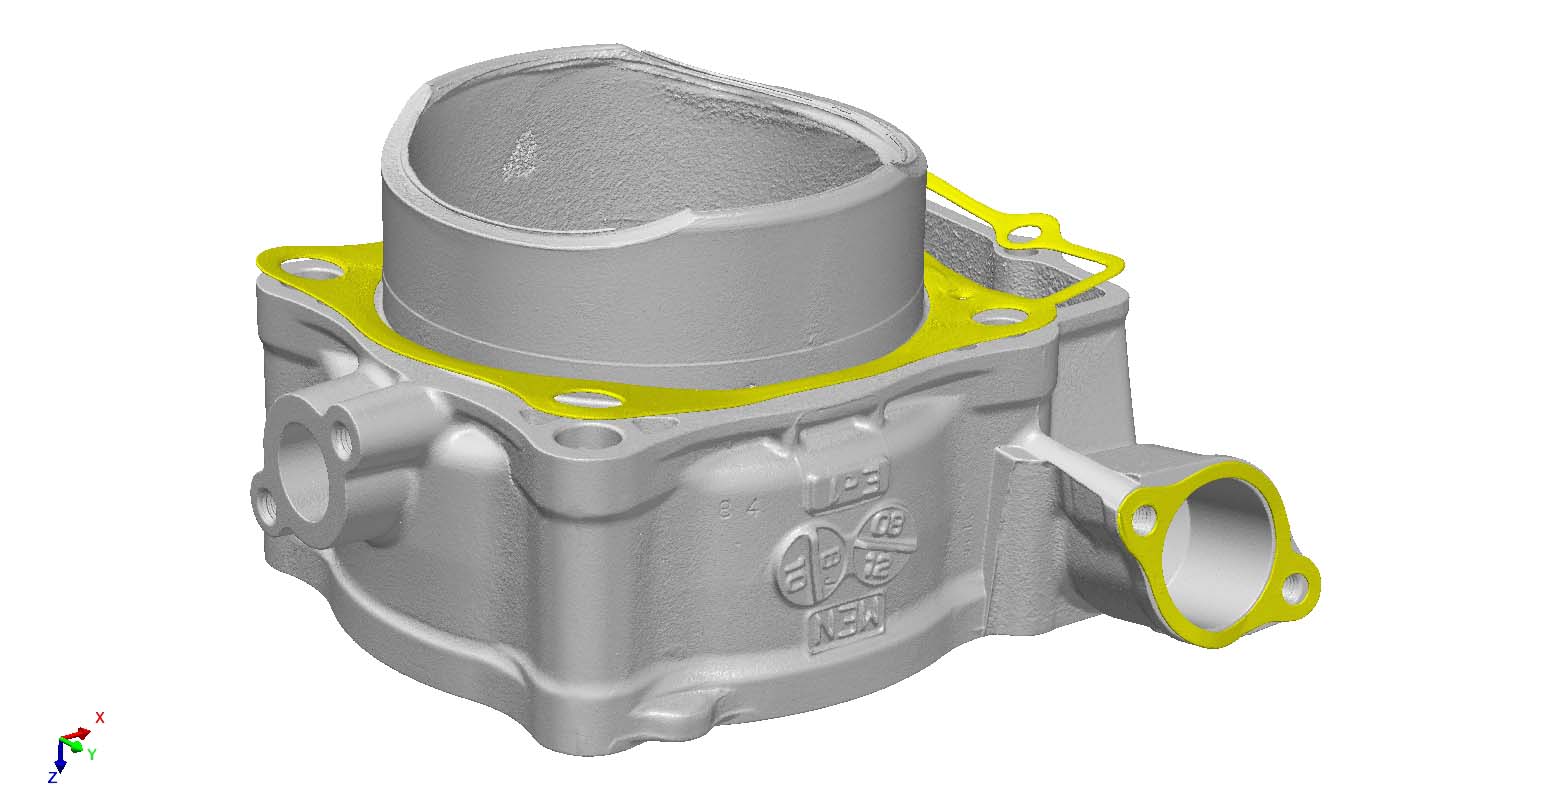
3D SCAN
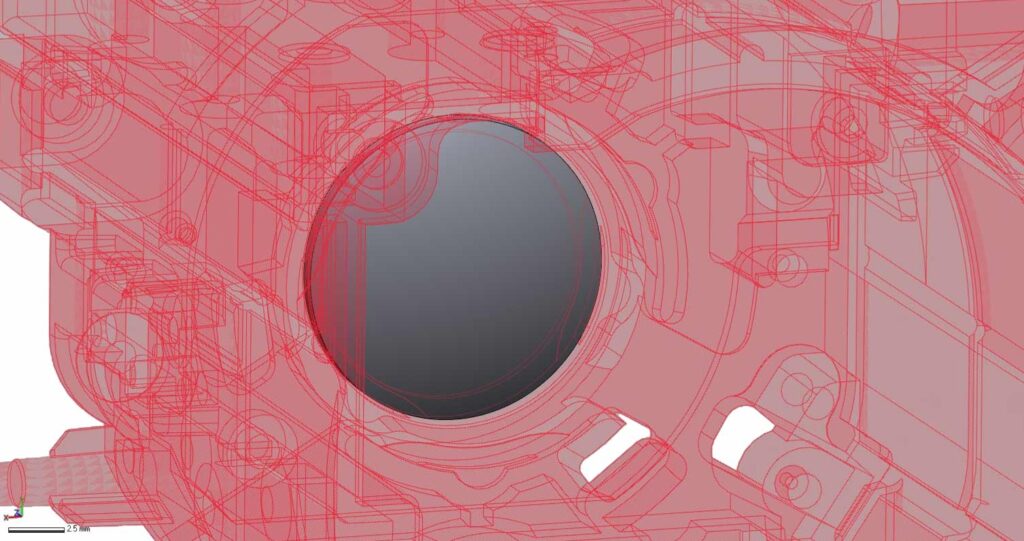
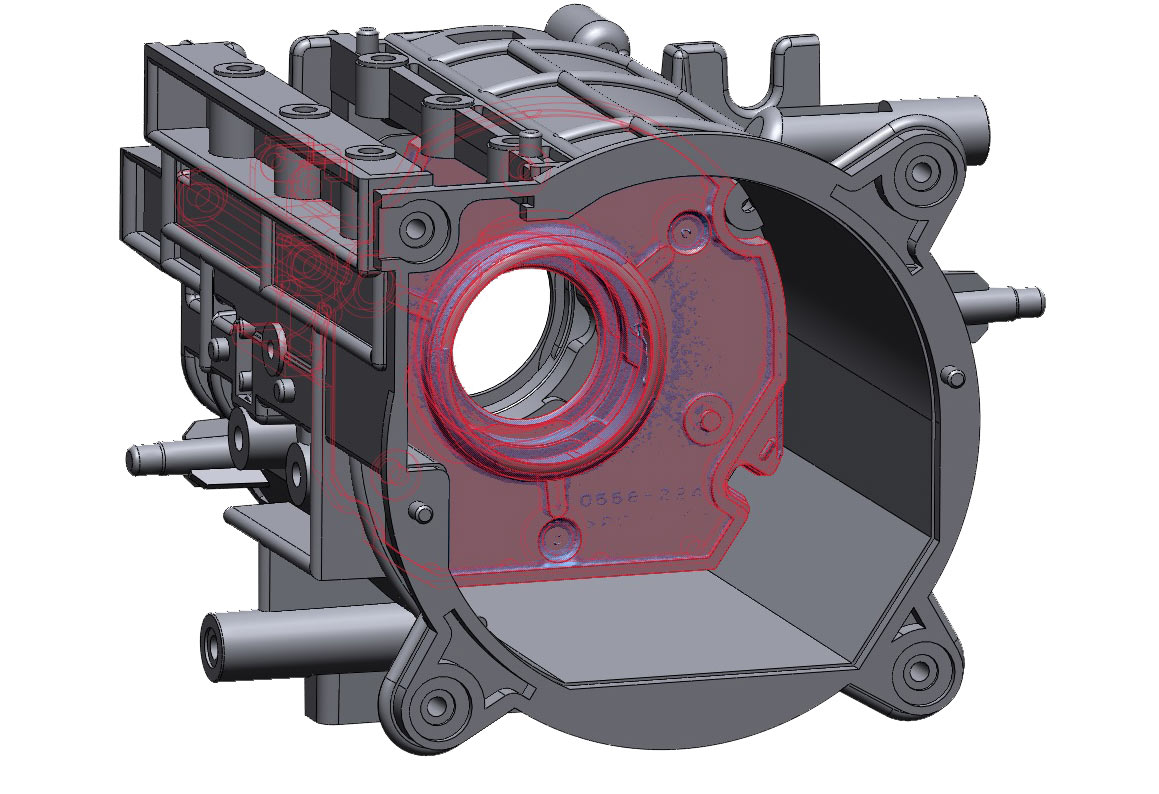
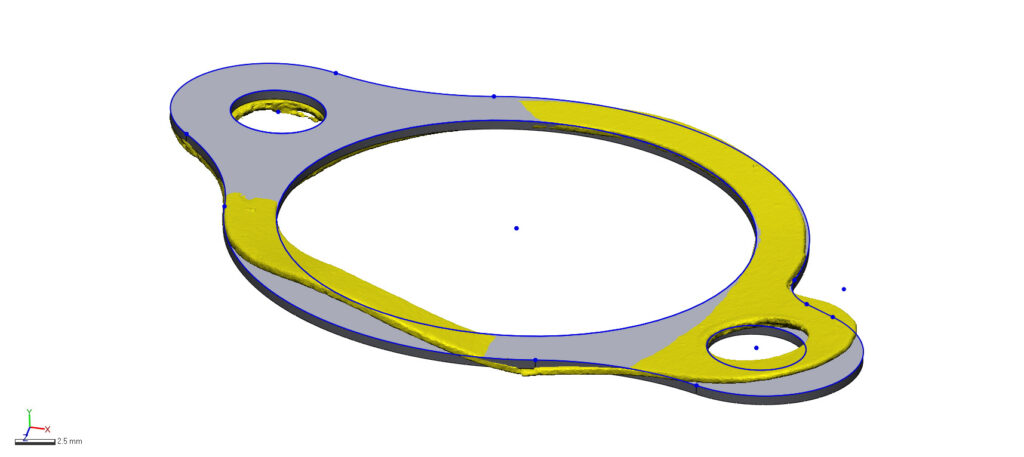
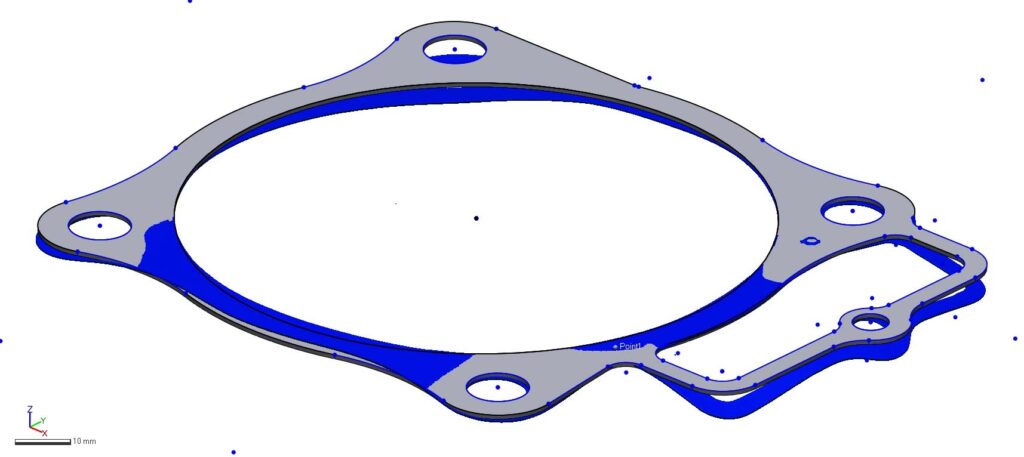
2D SKETCHES
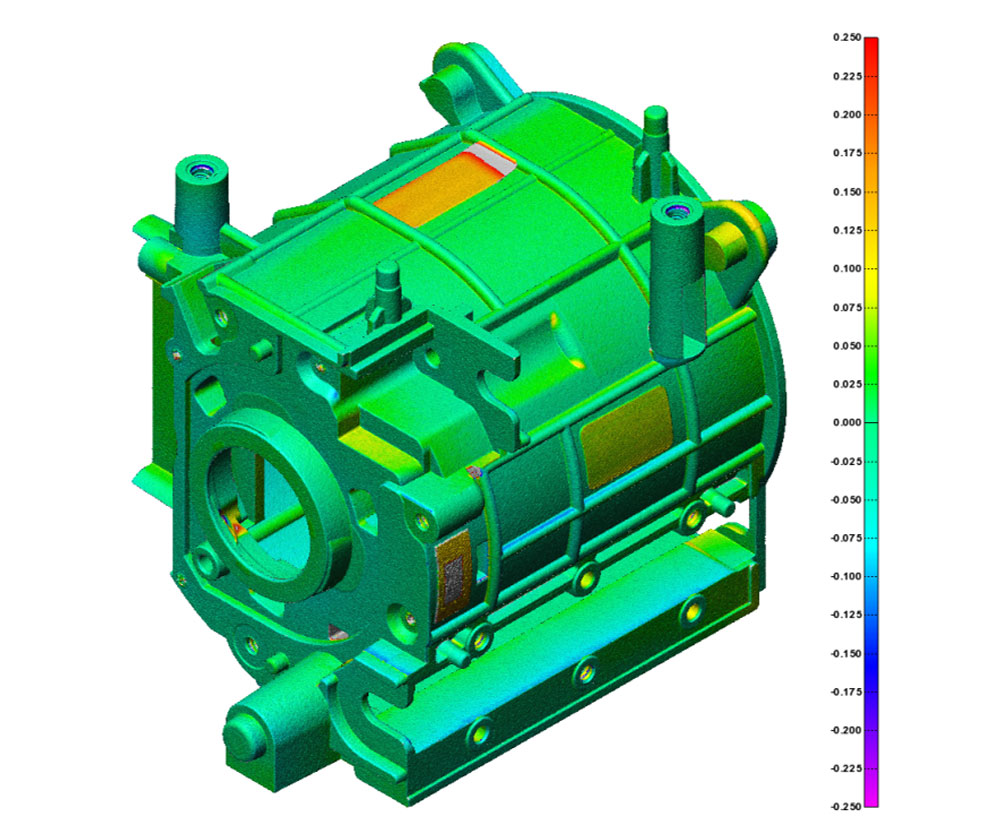
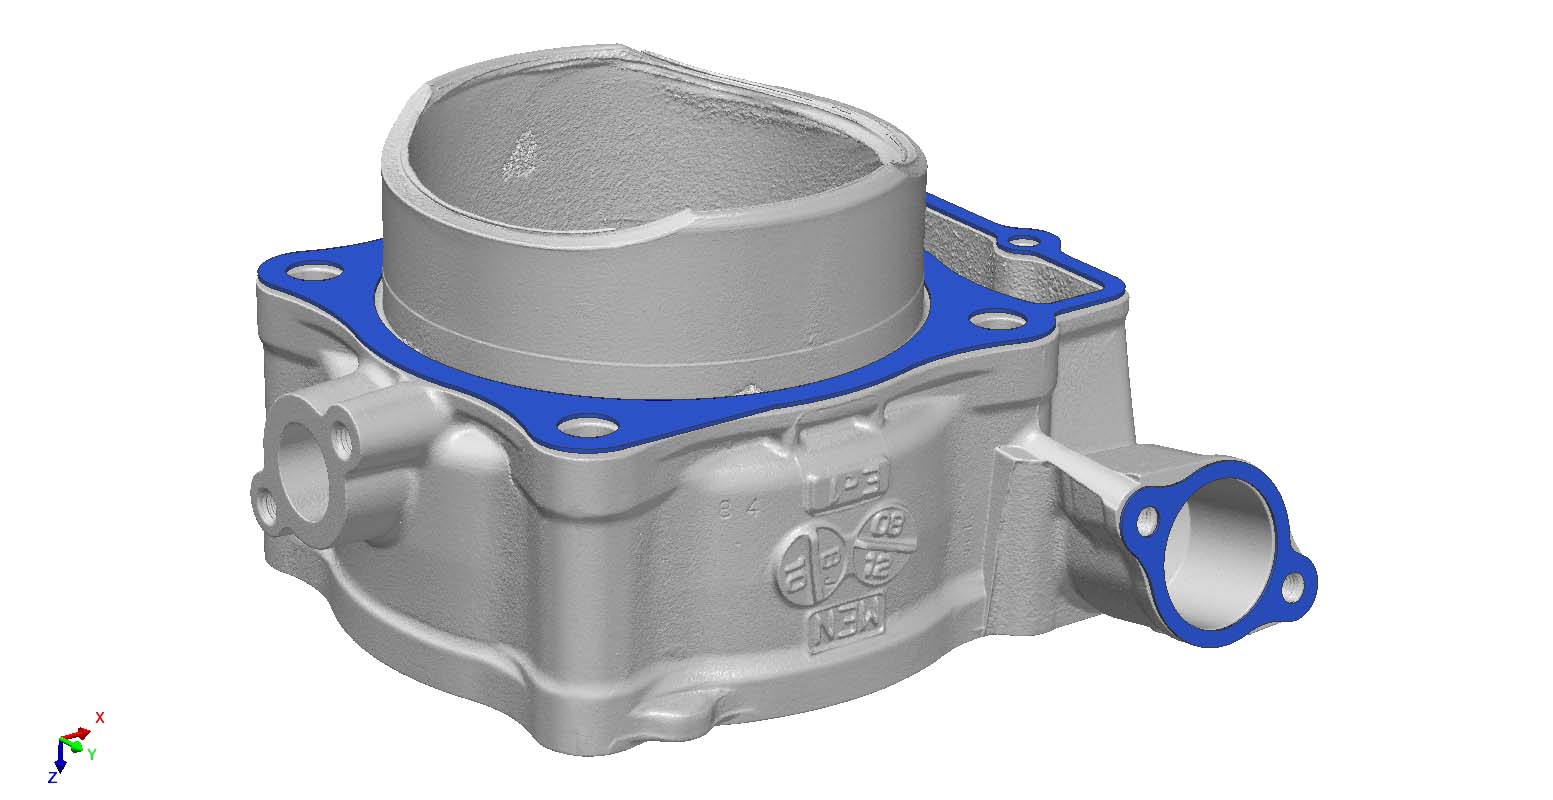
SOLID MODEL

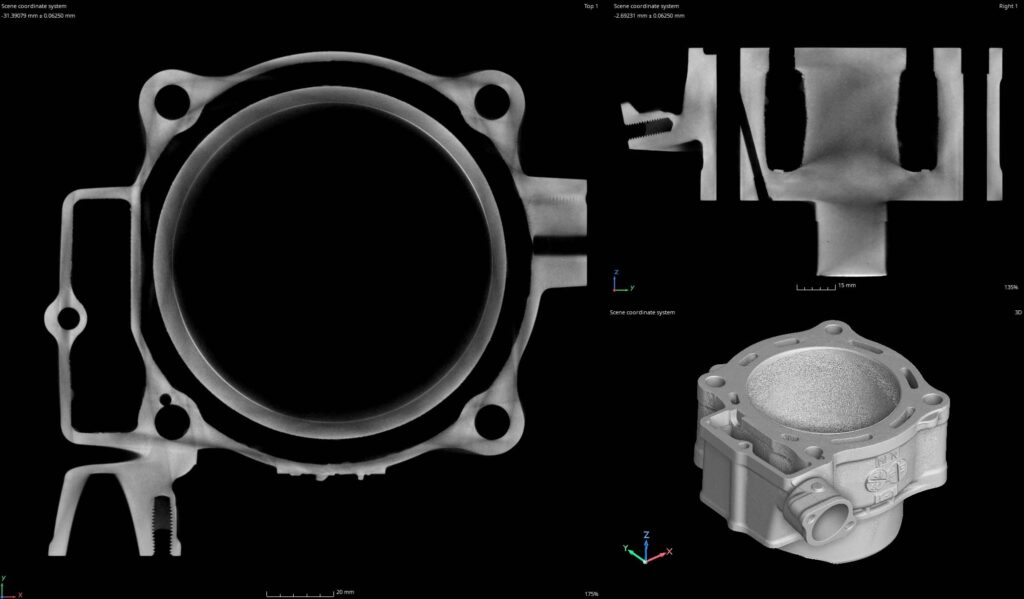

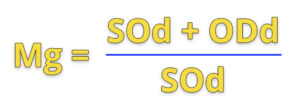
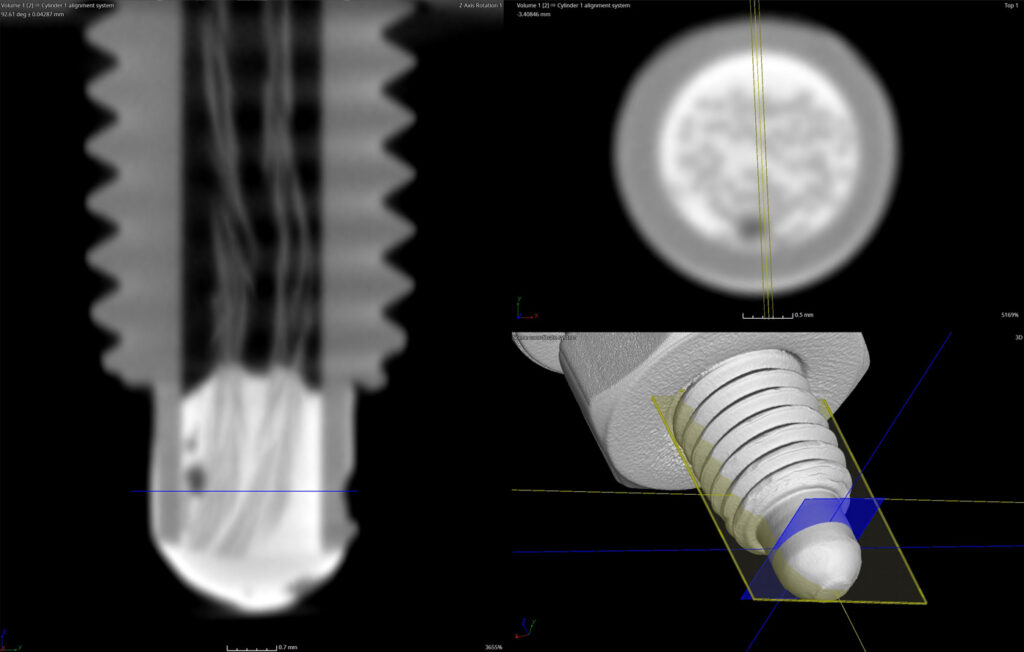
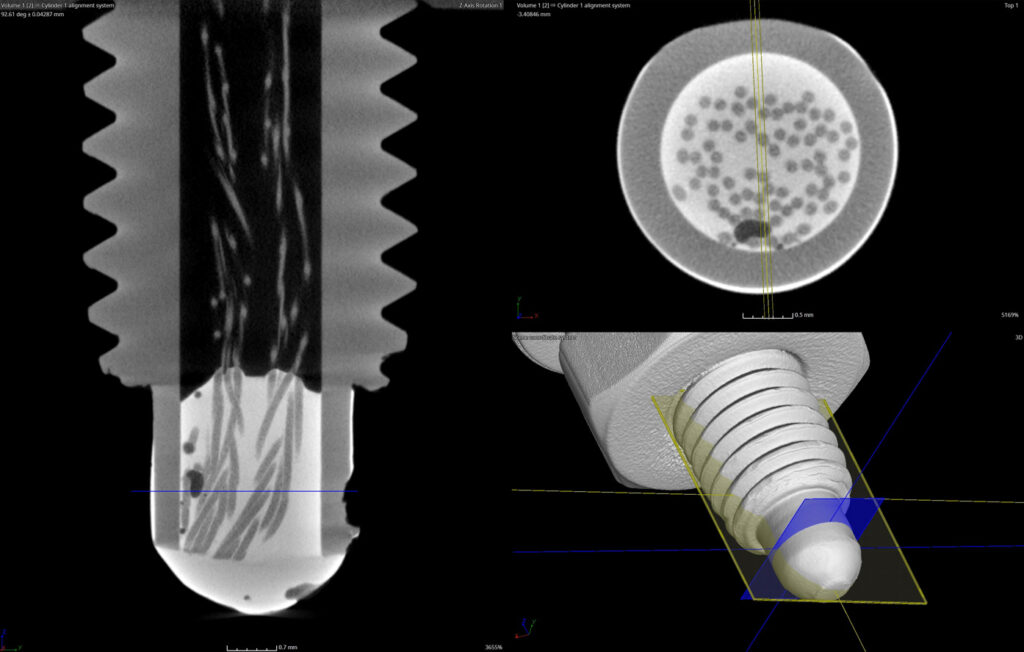
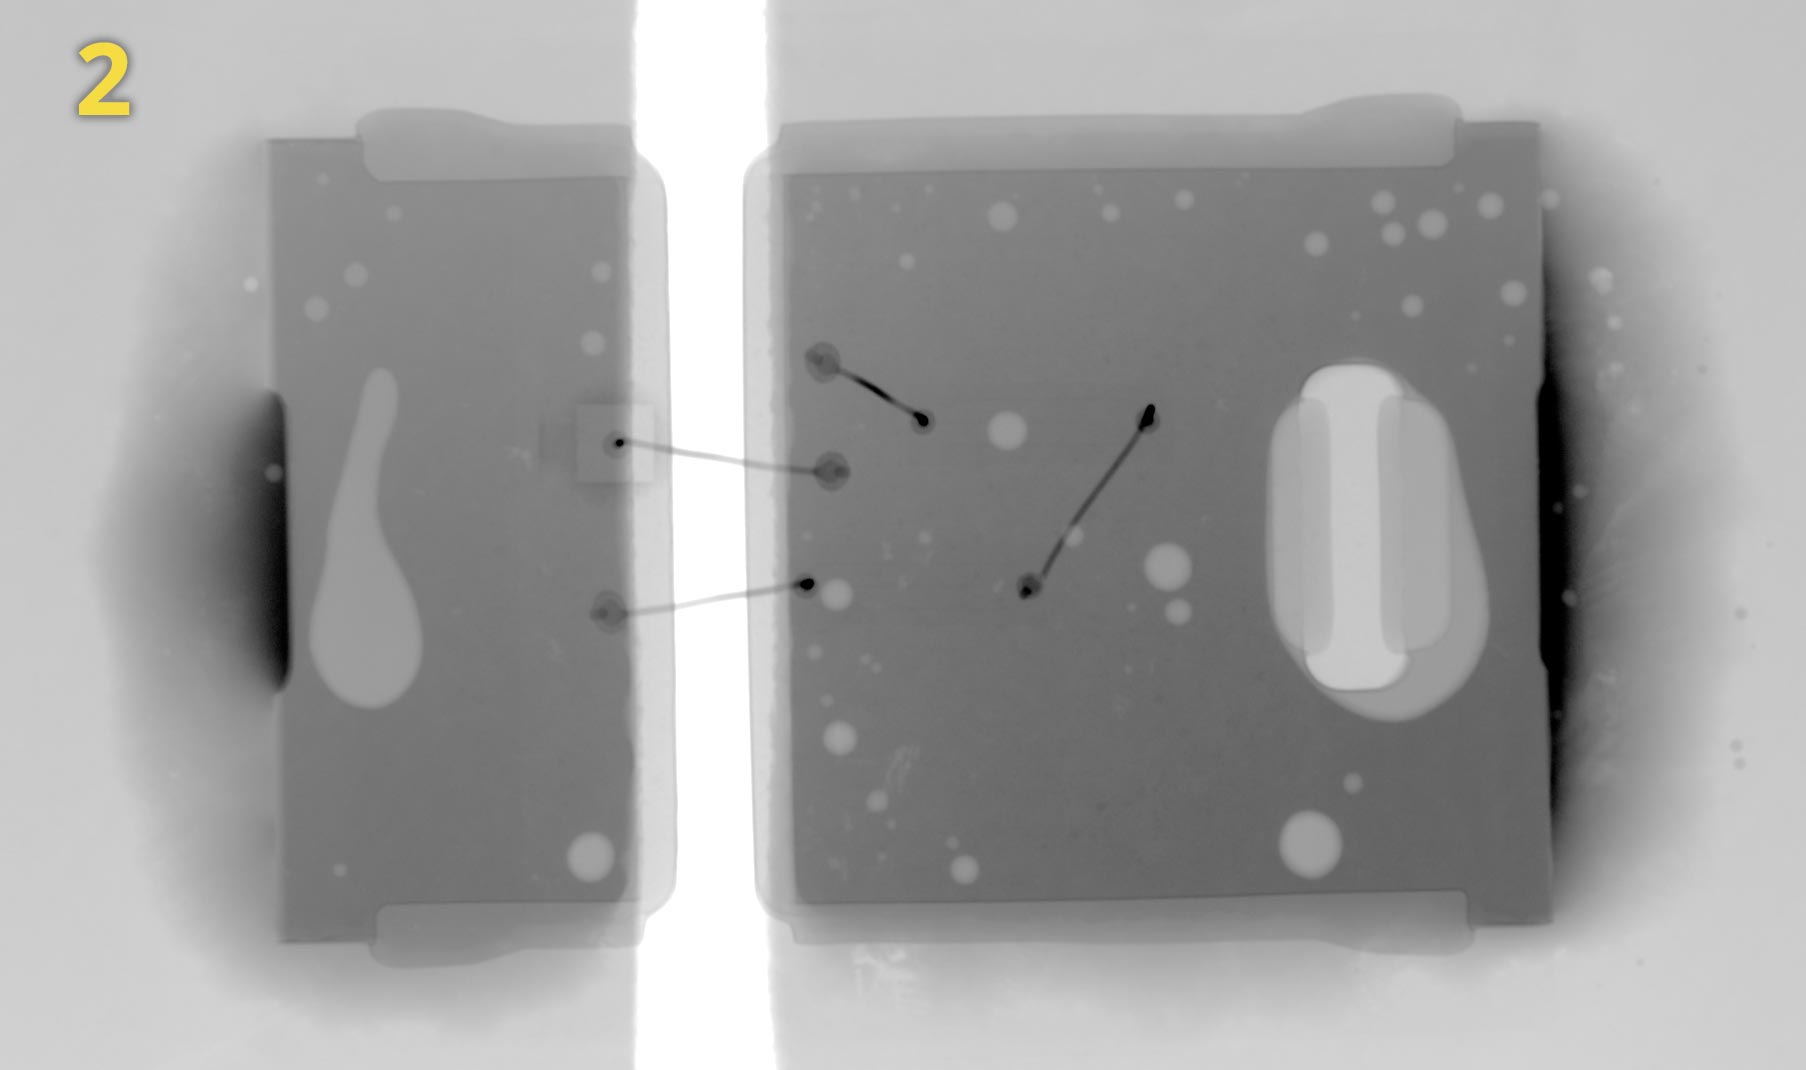
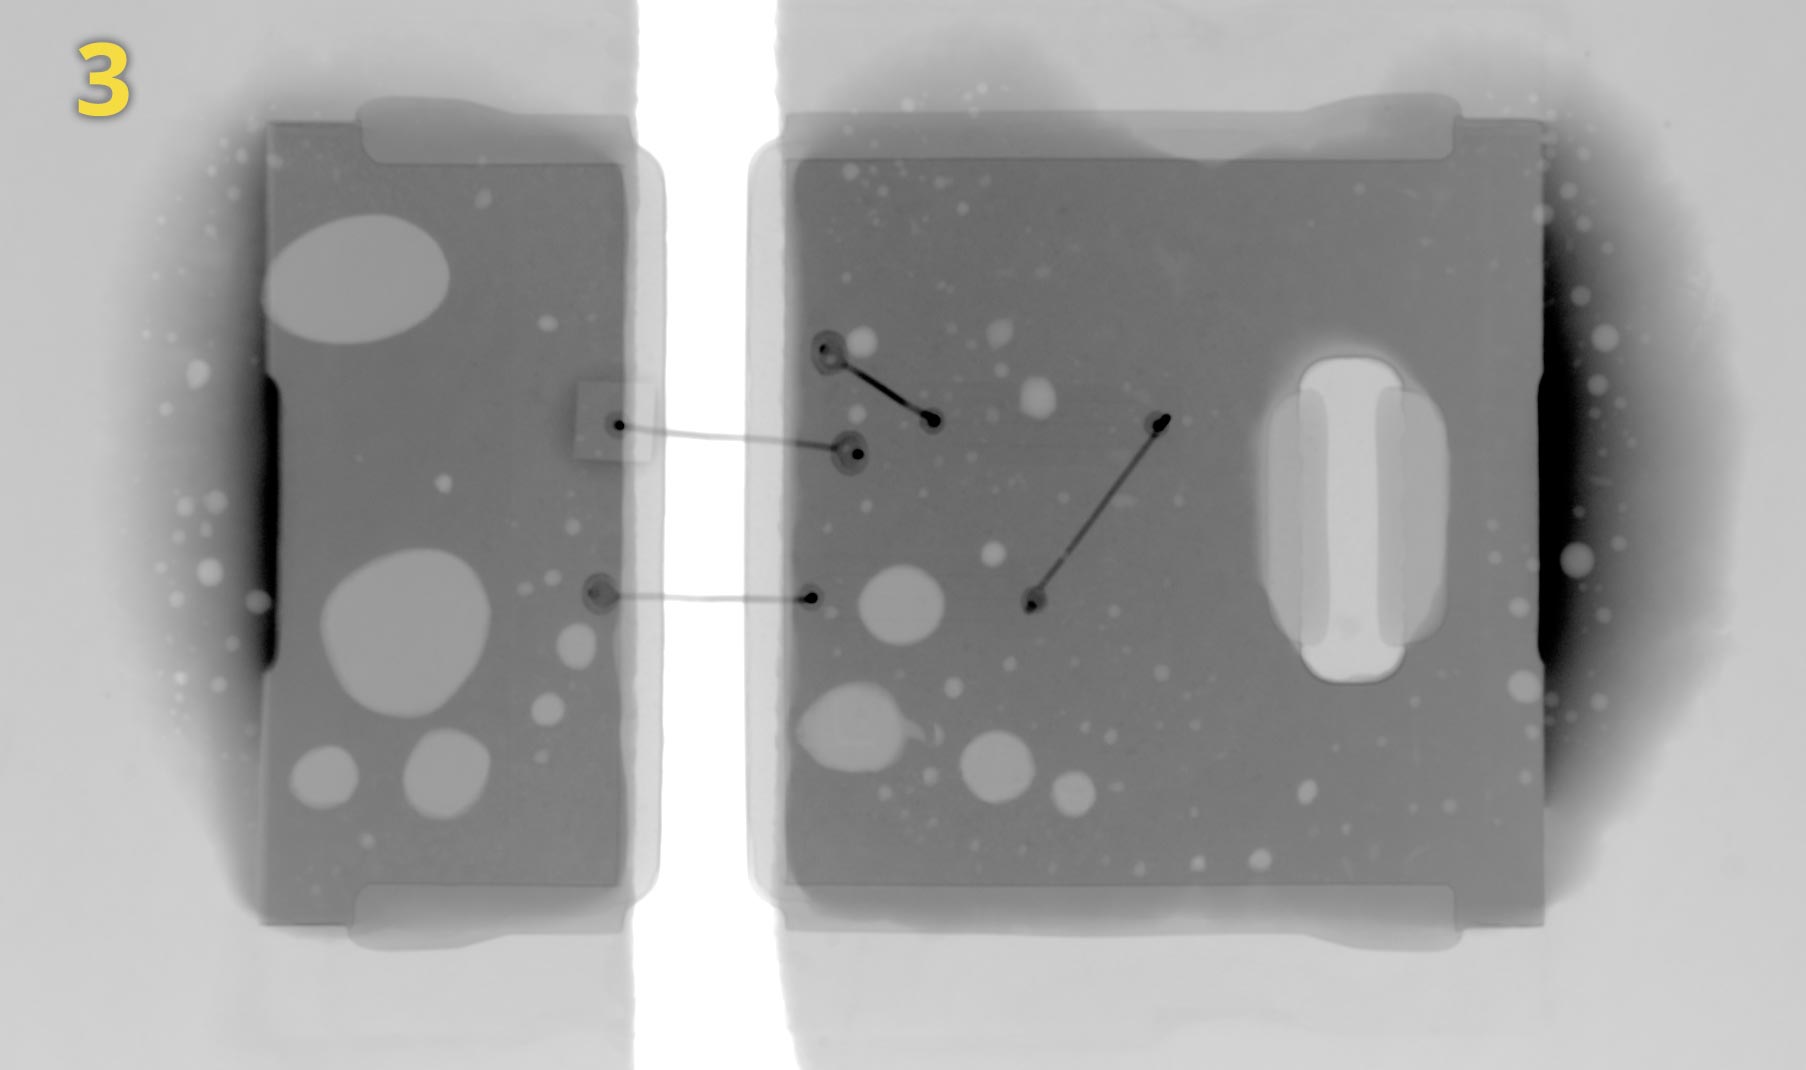
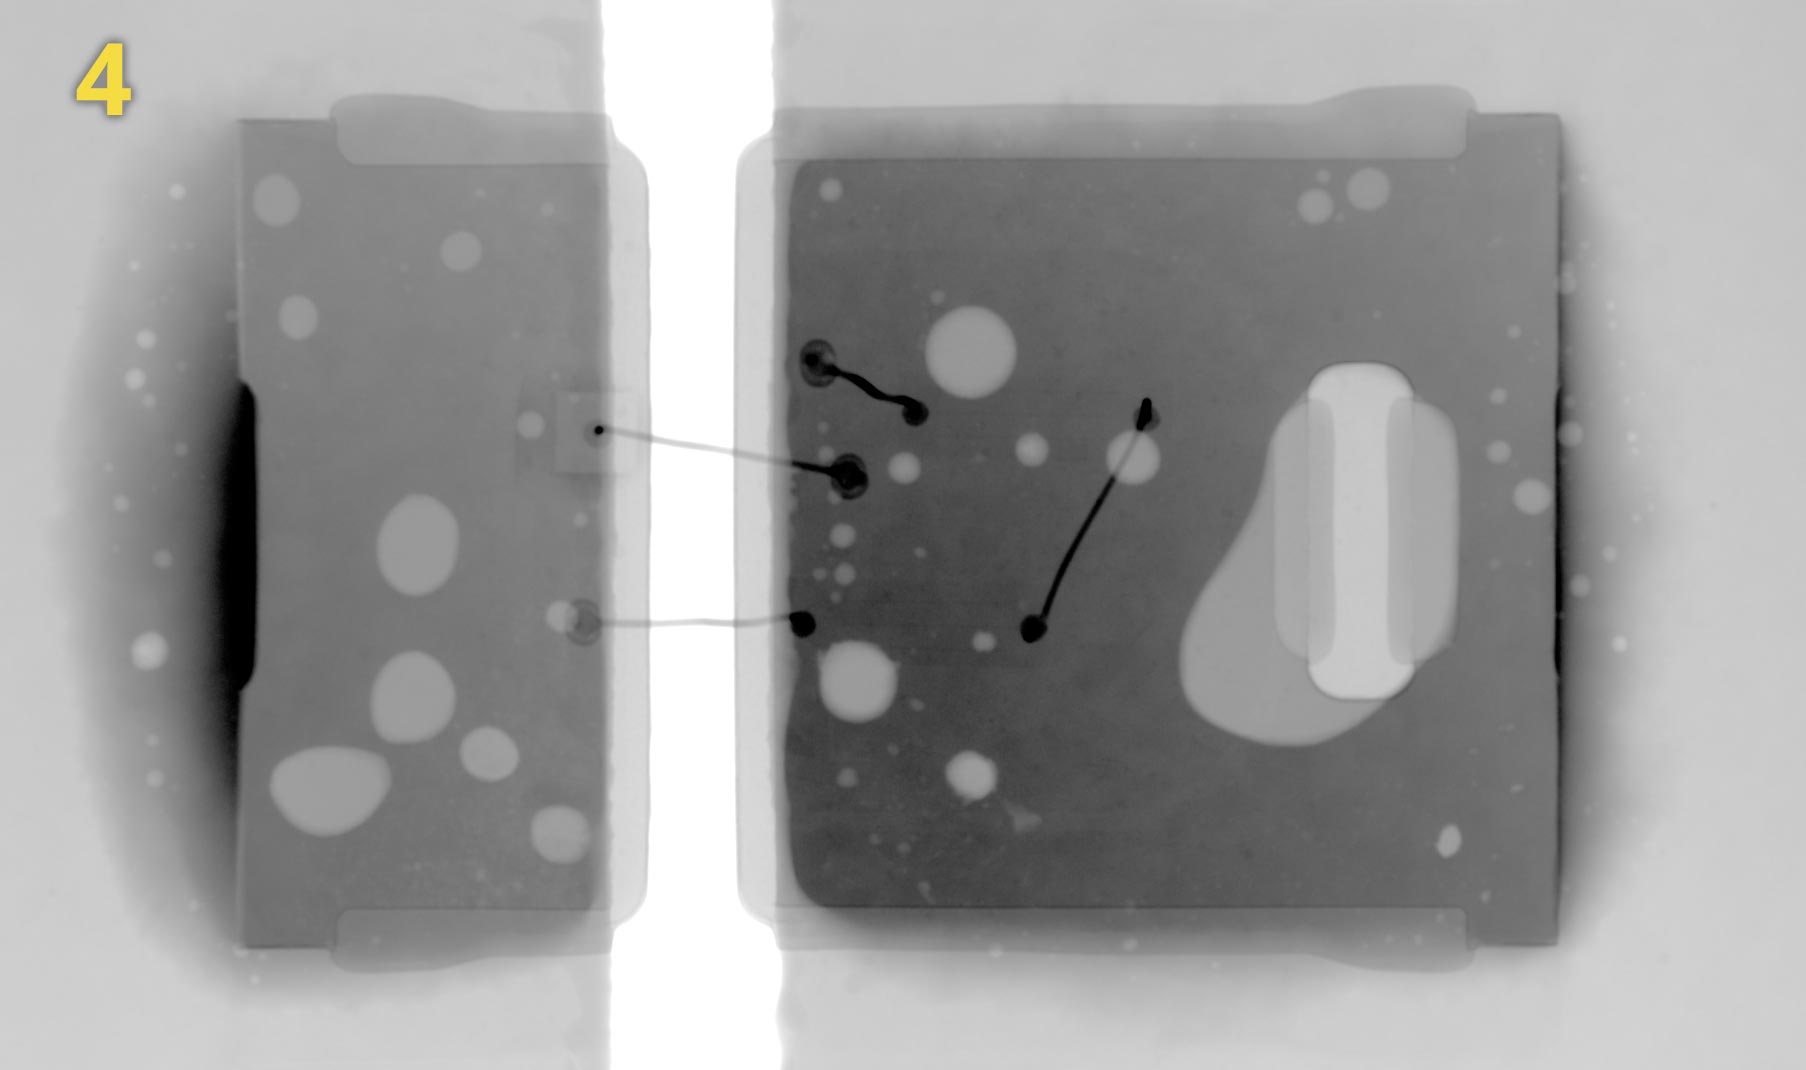
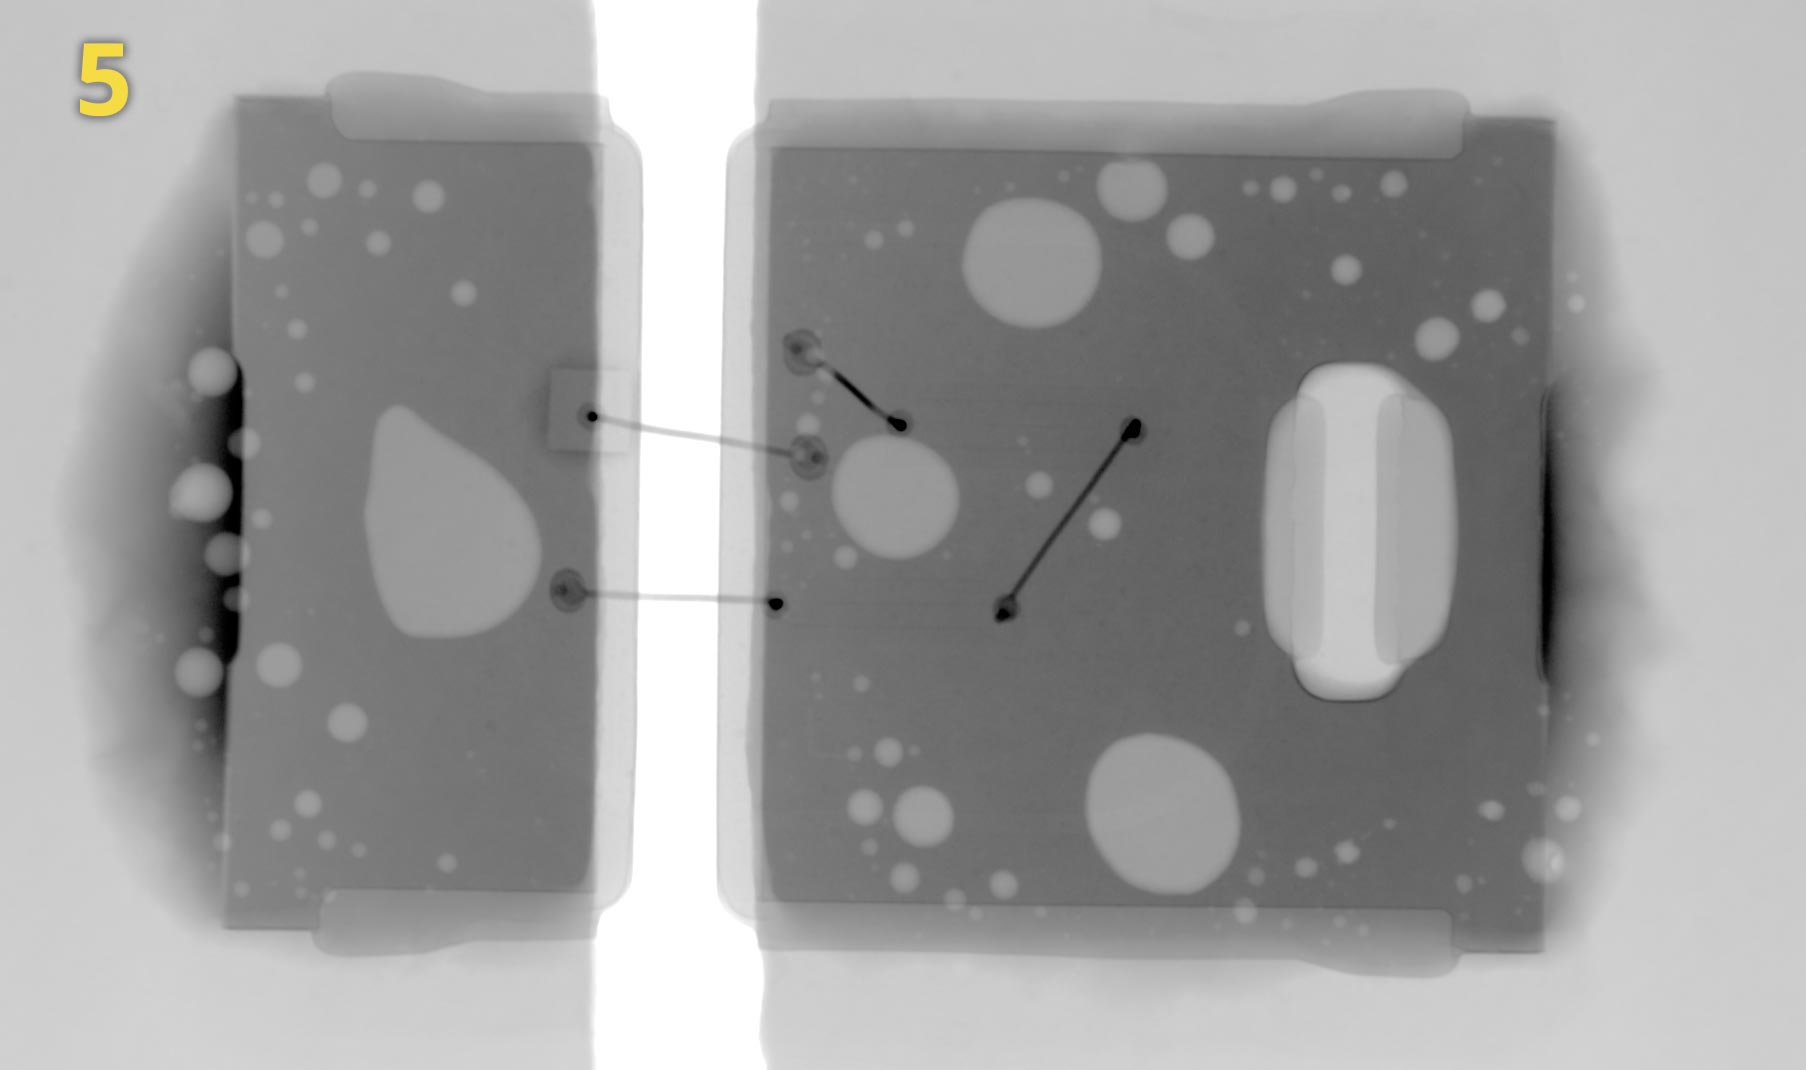
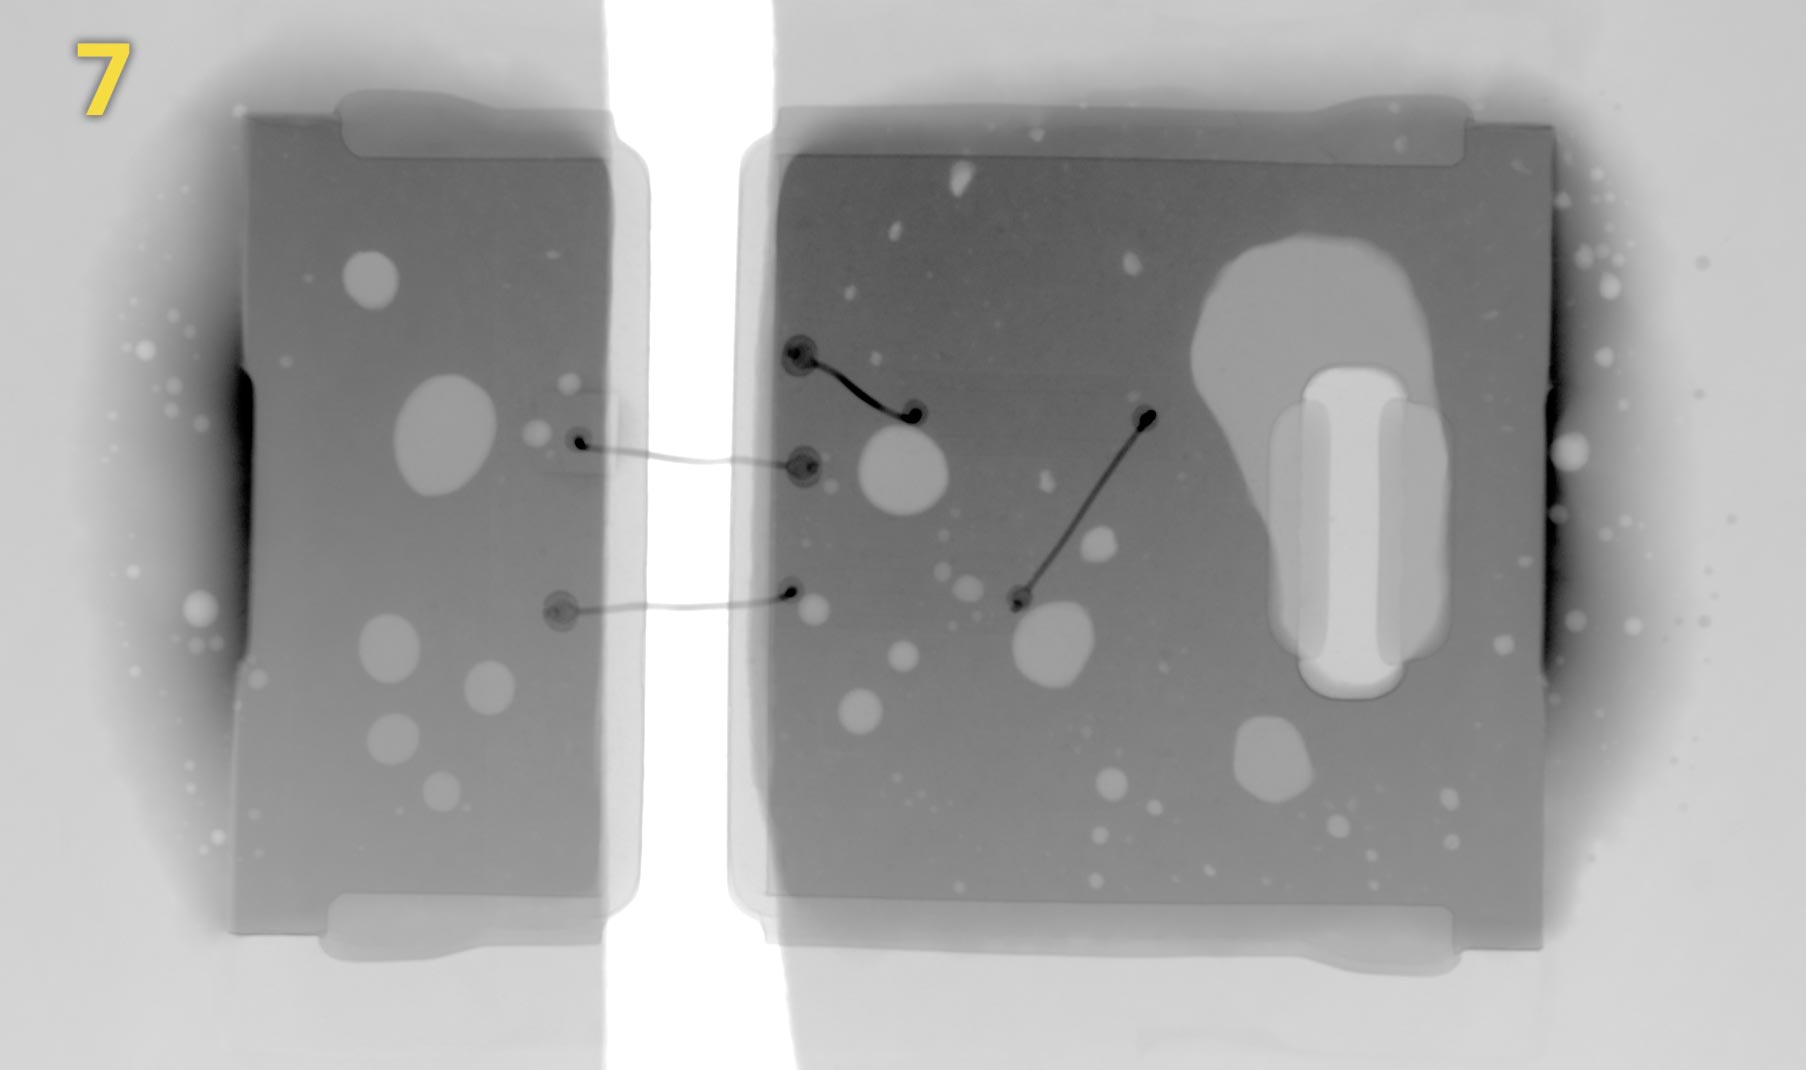
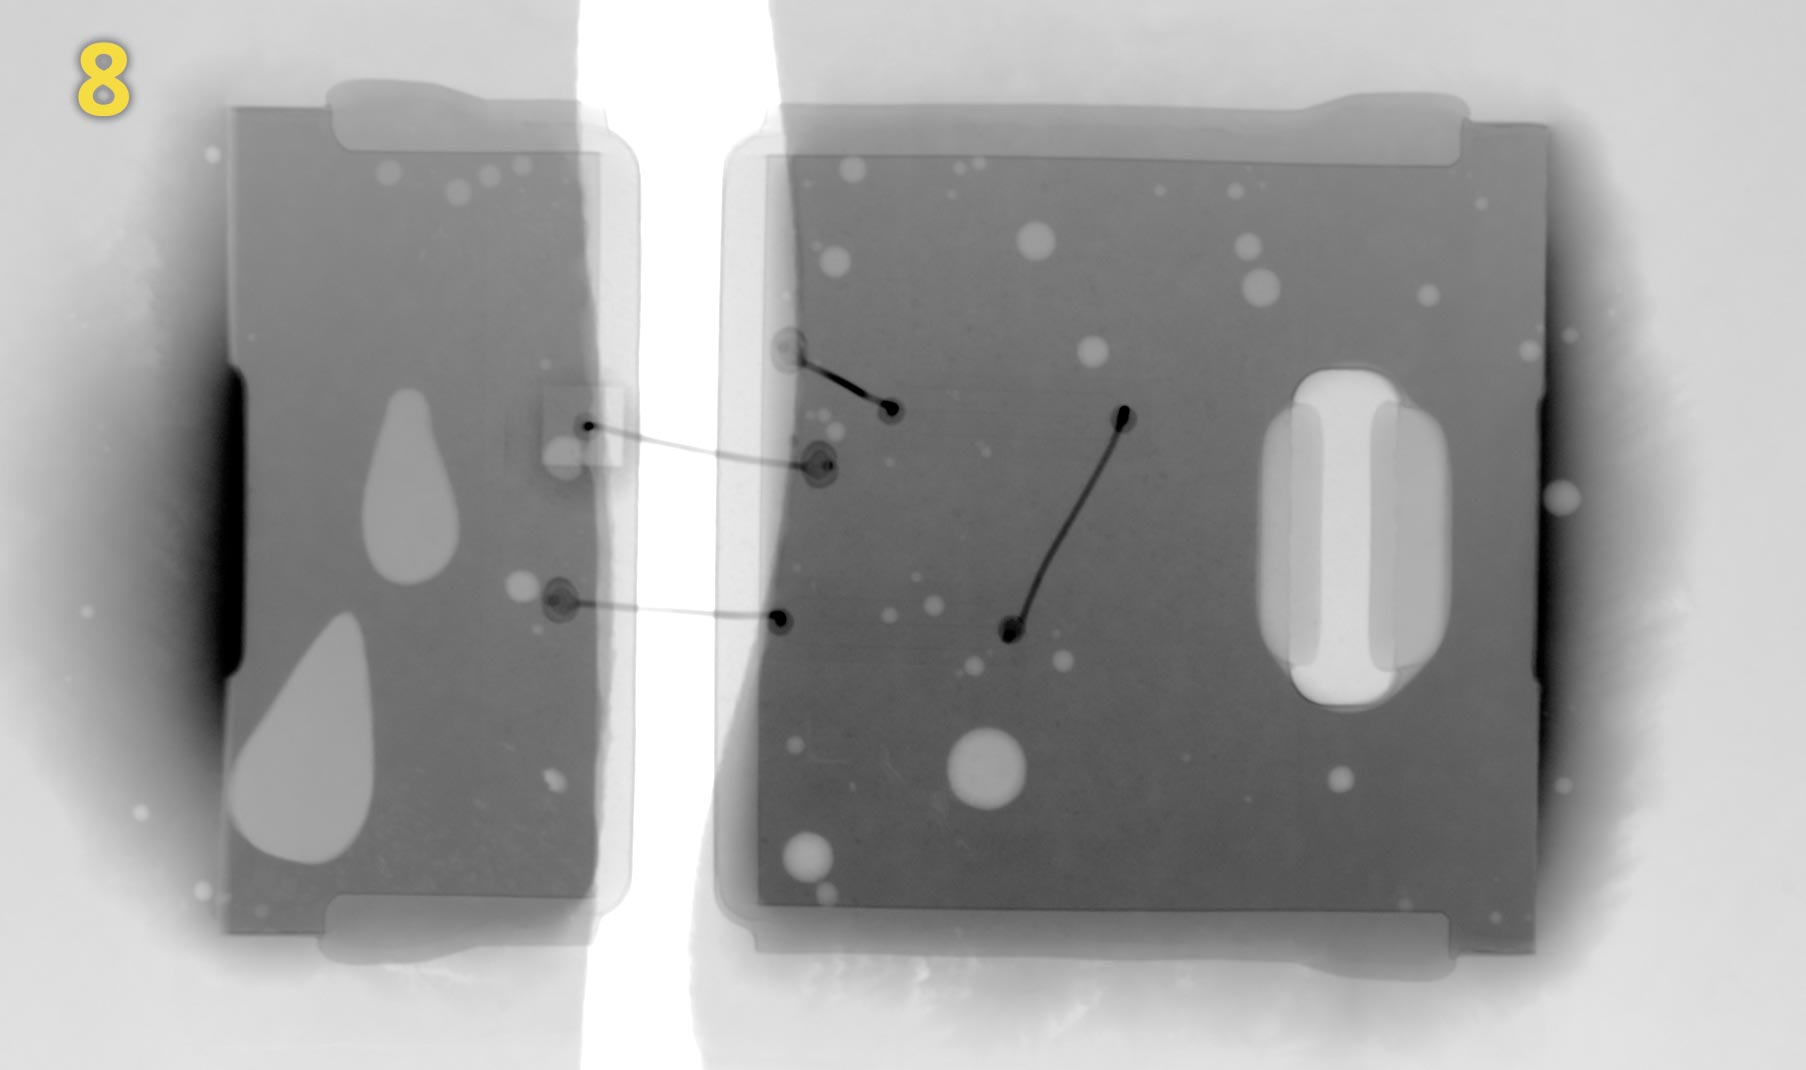
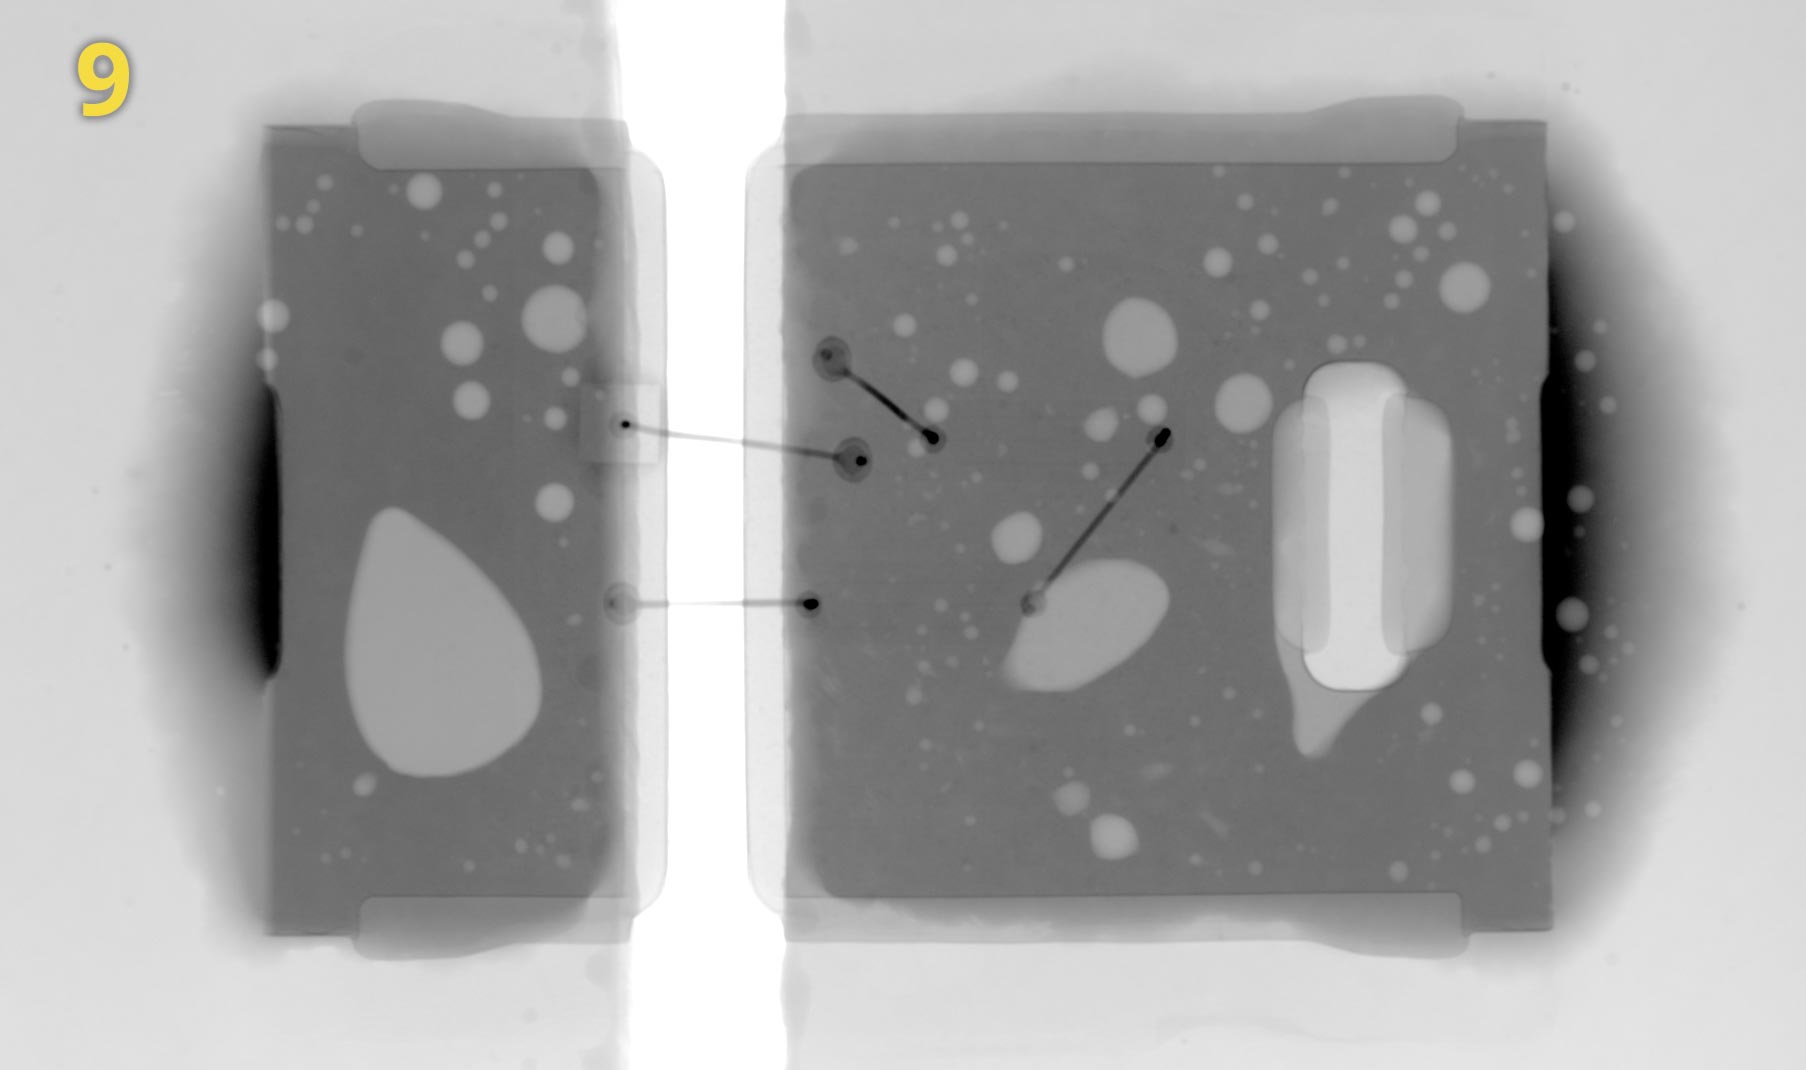
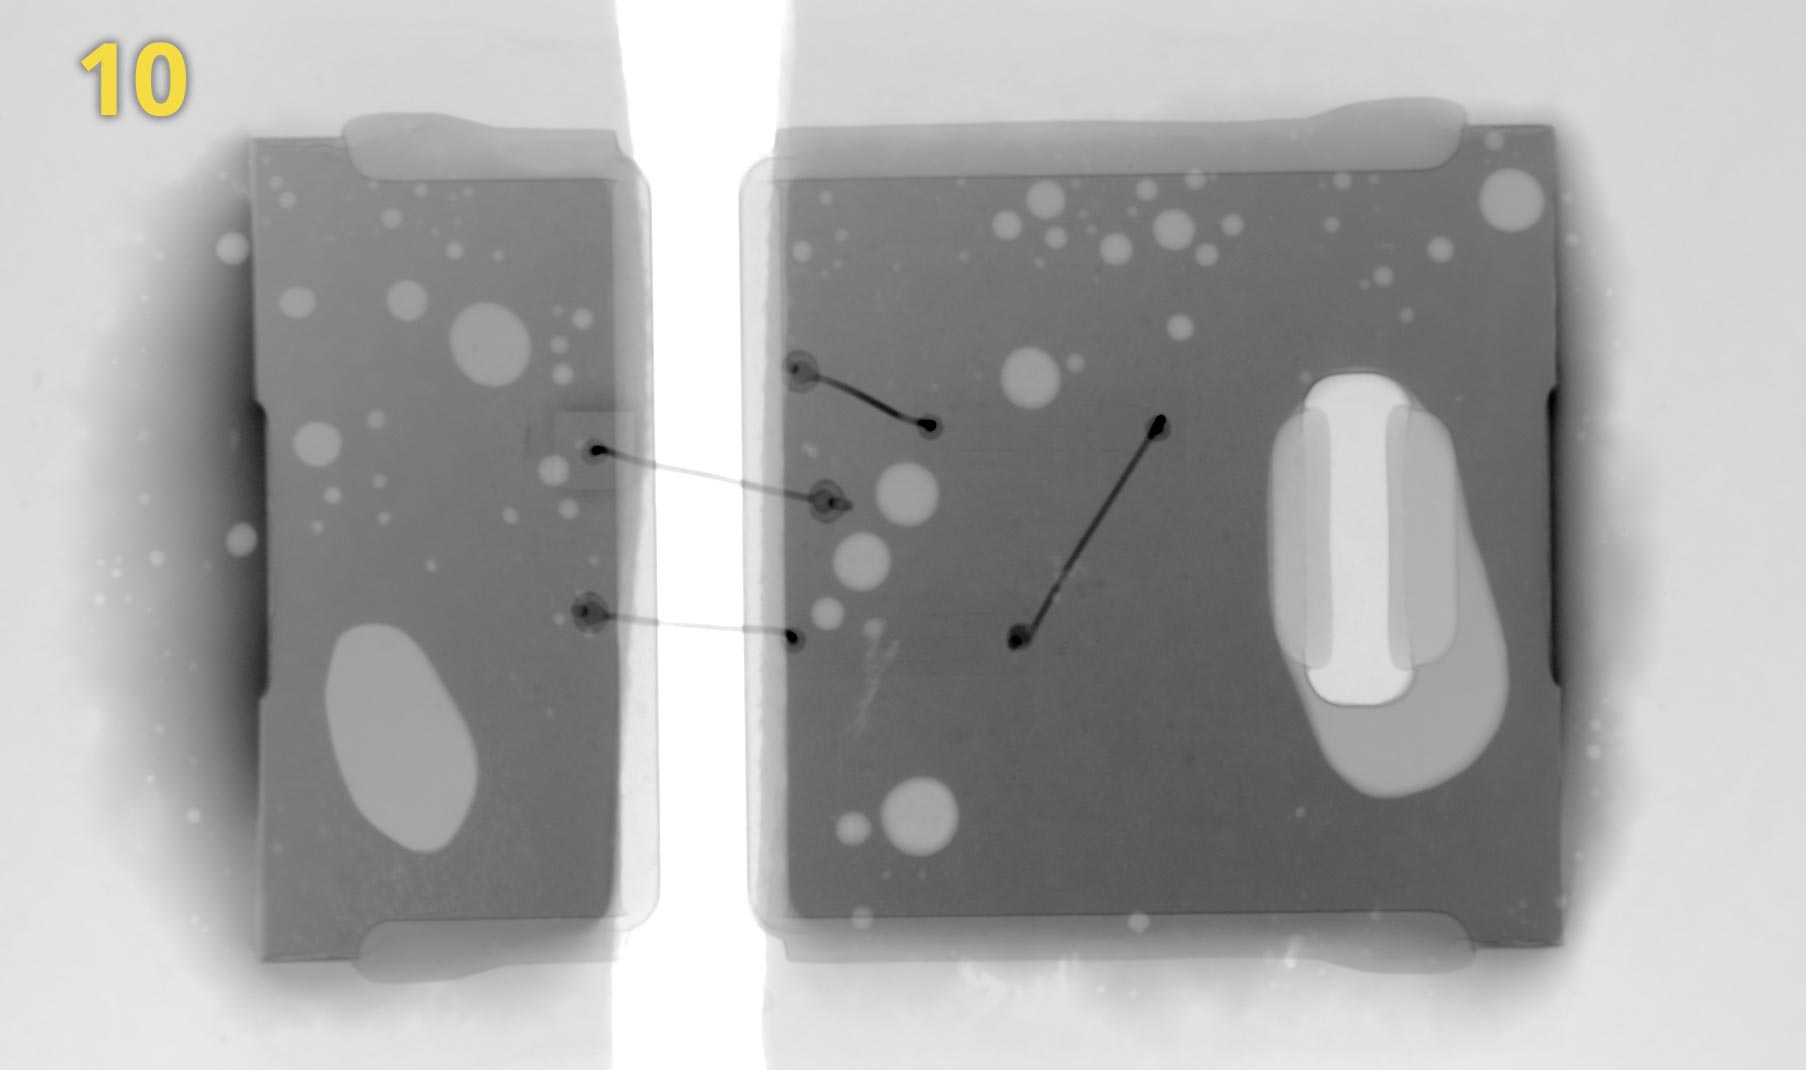
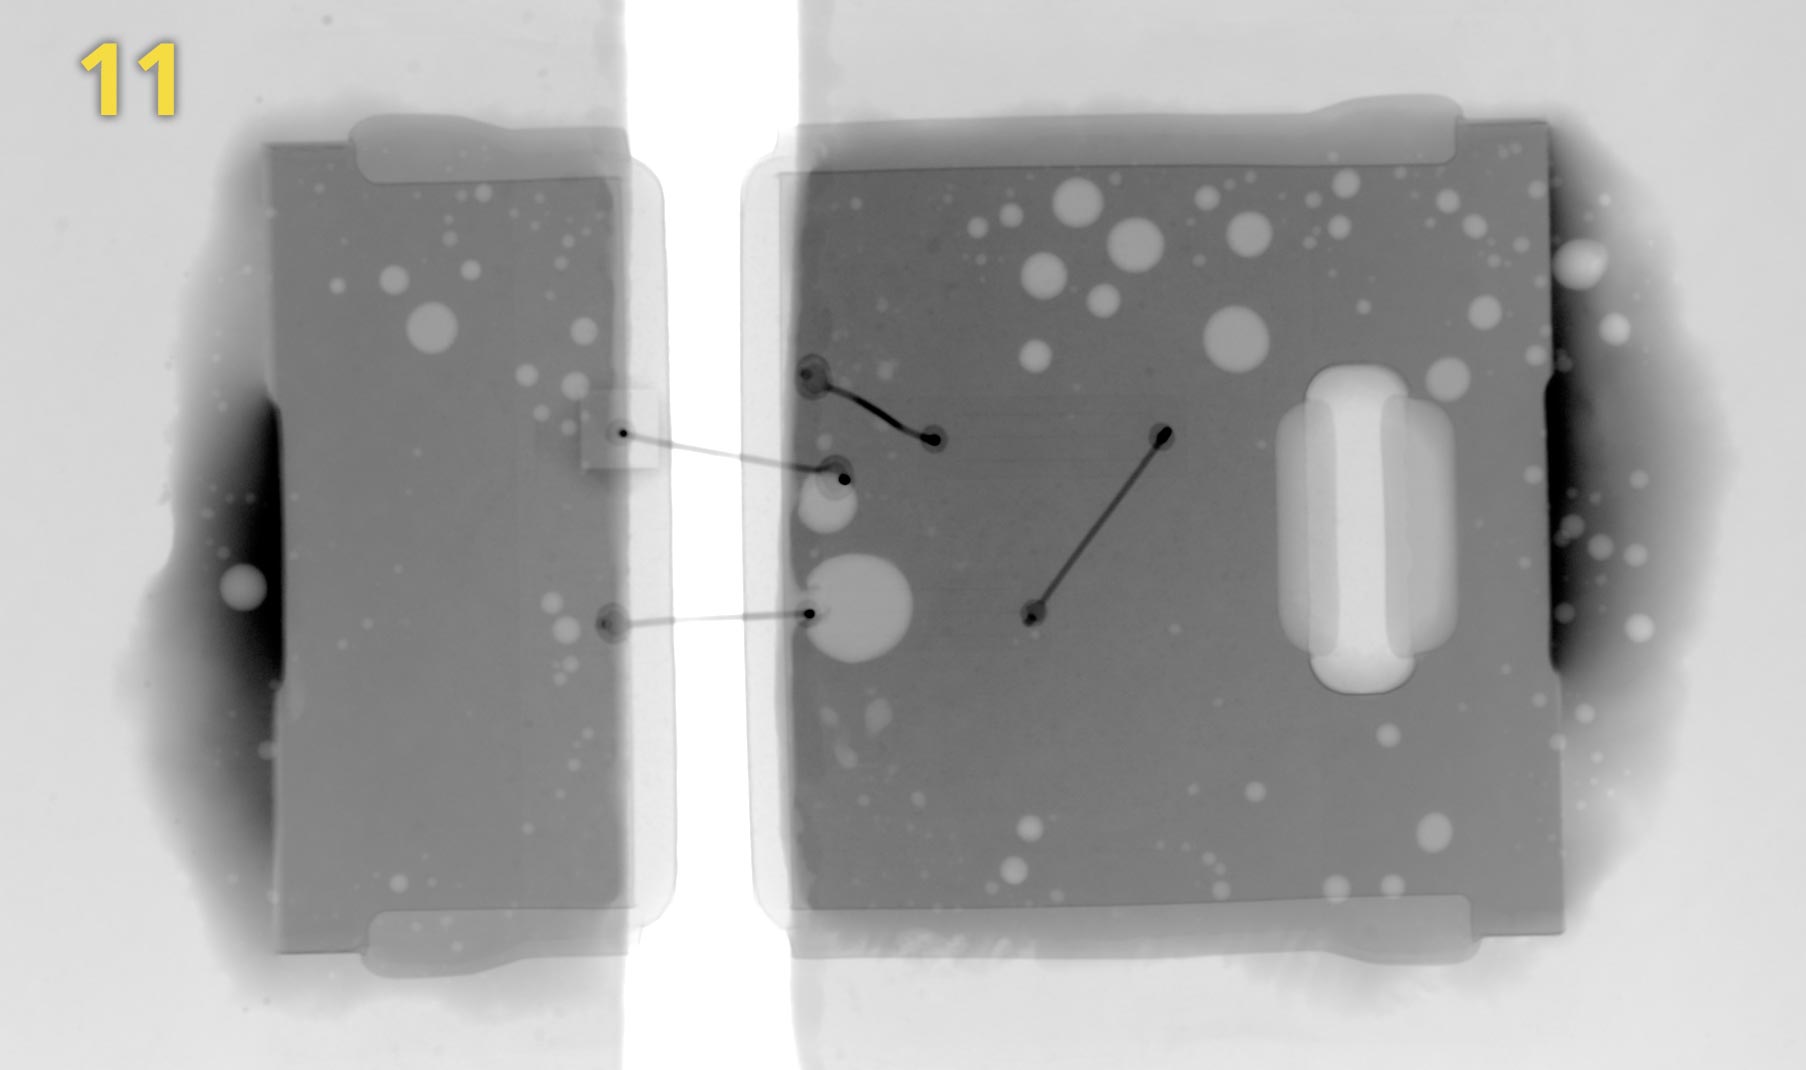
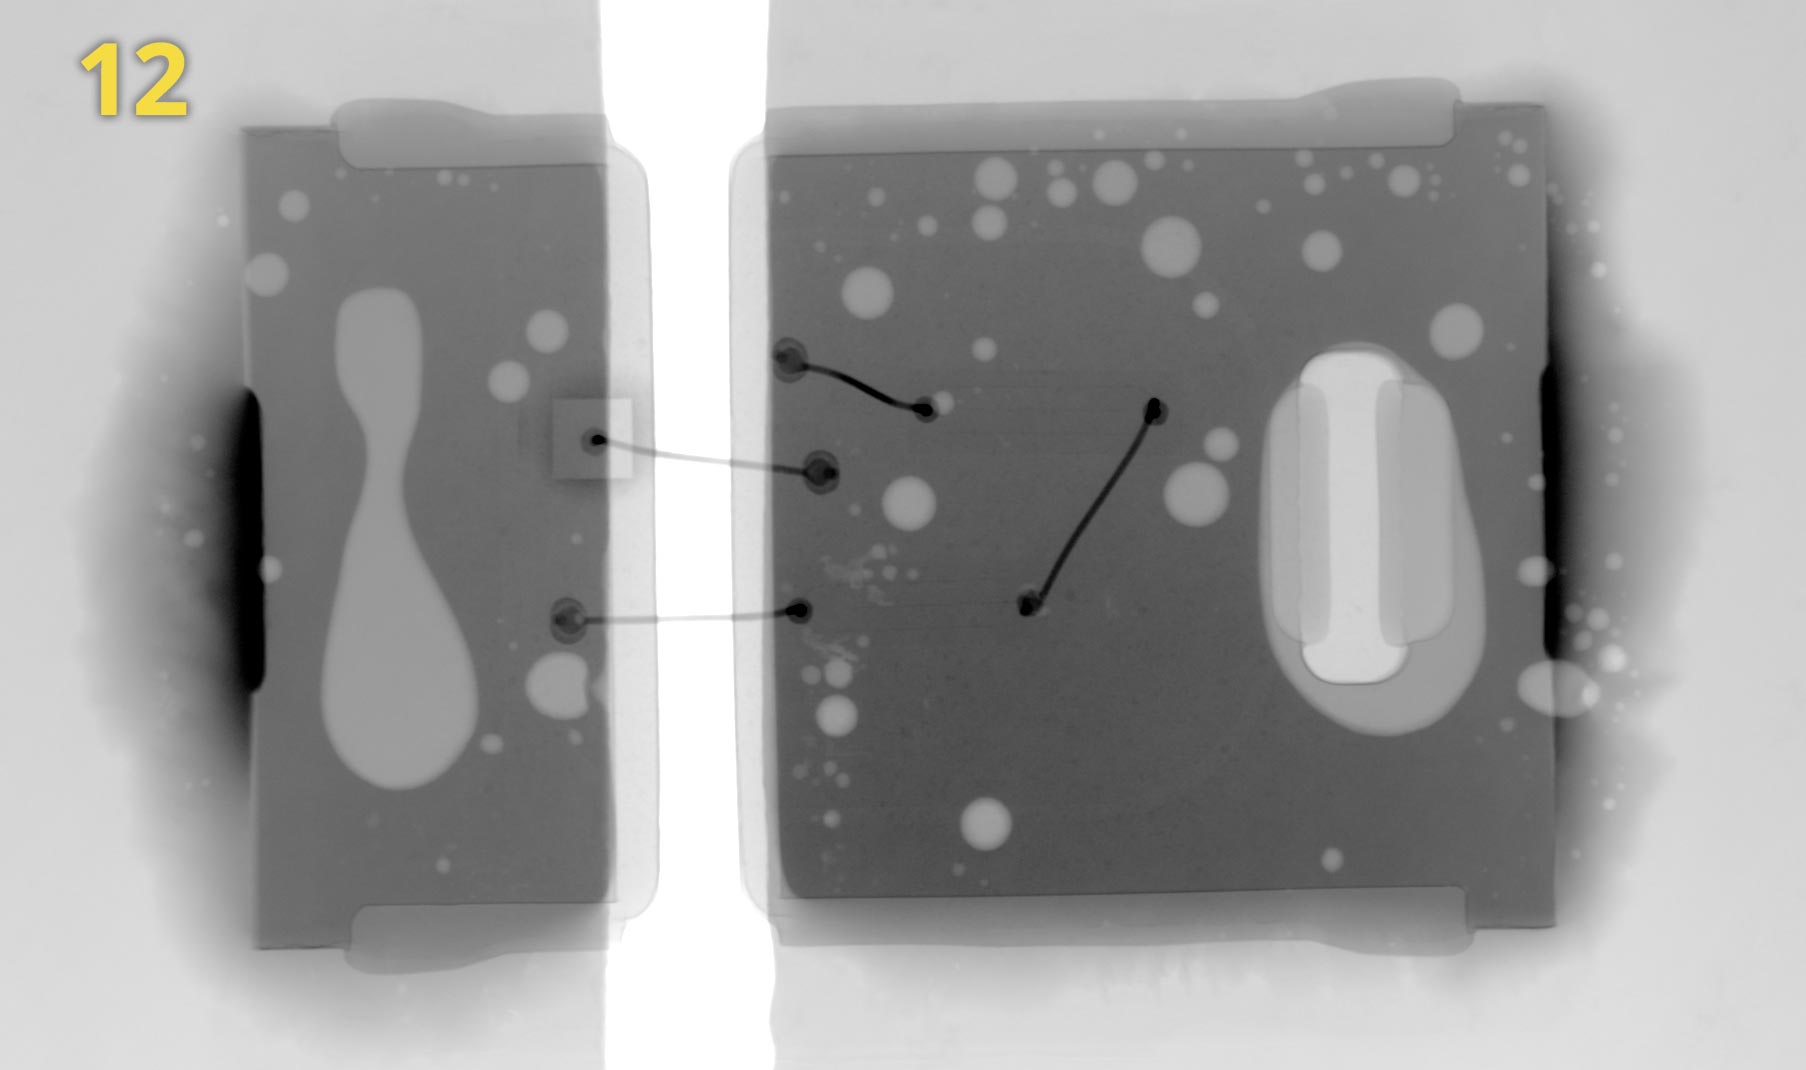
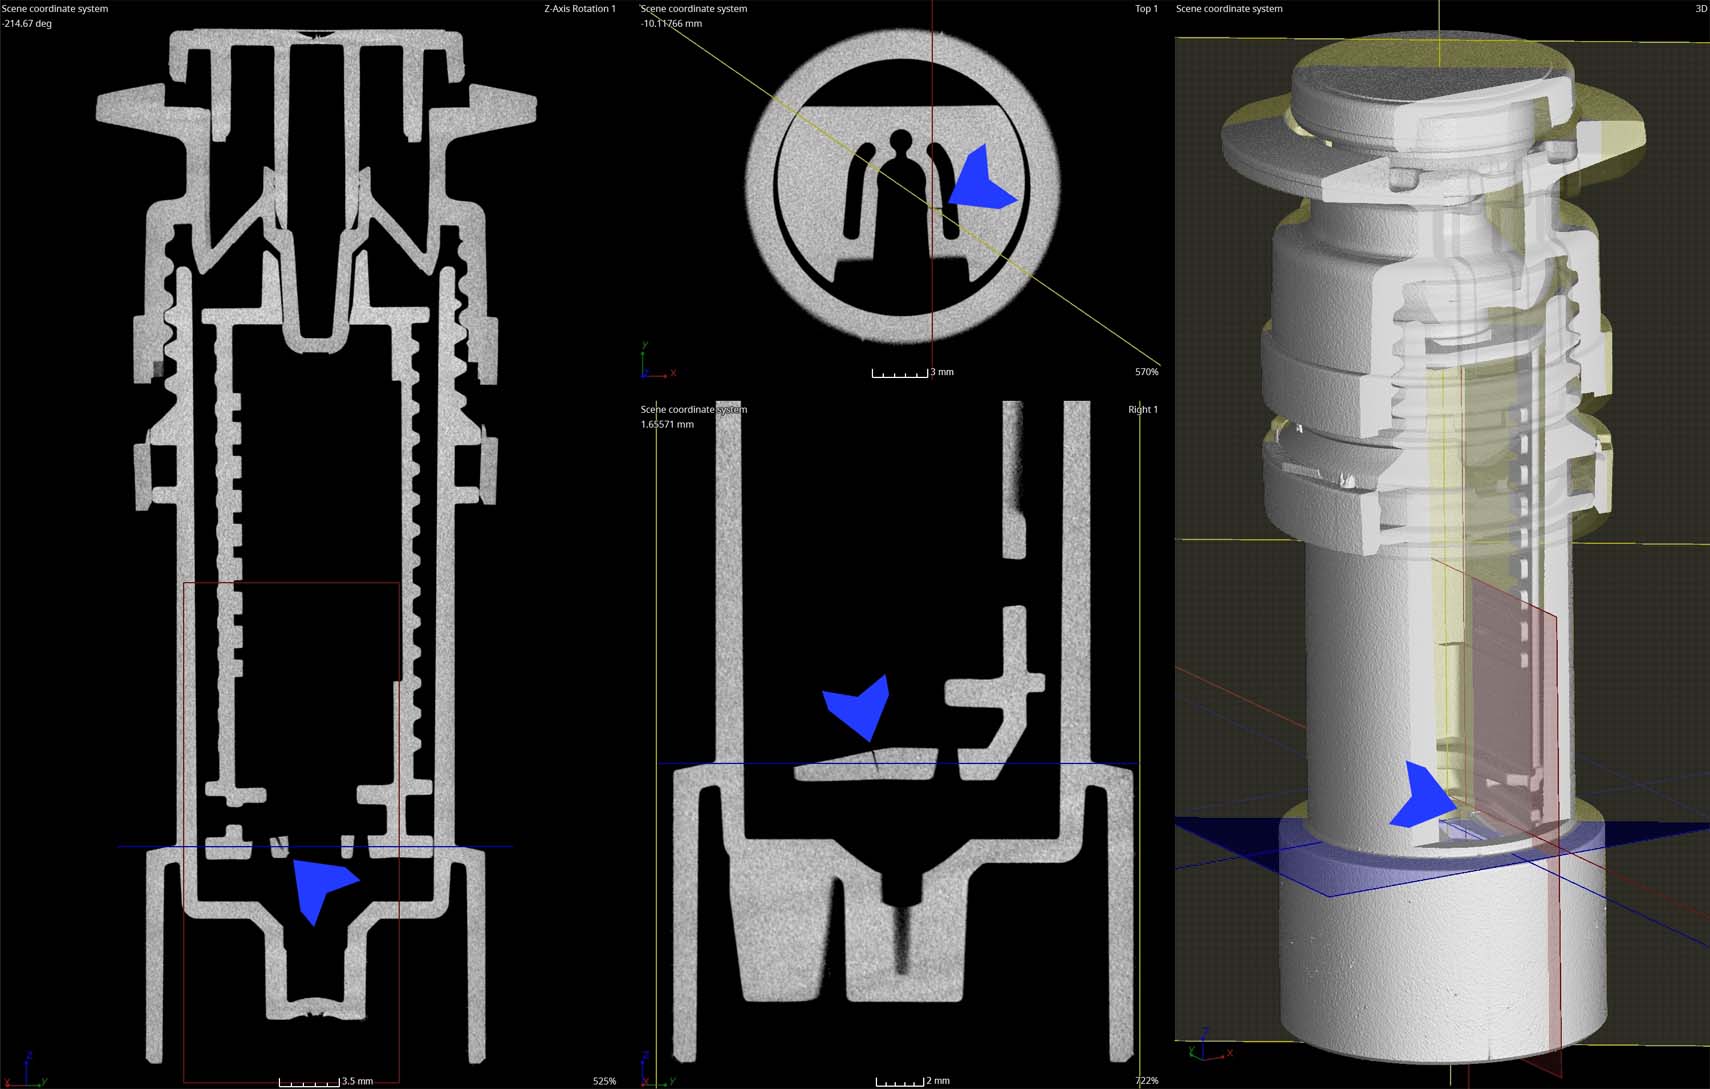
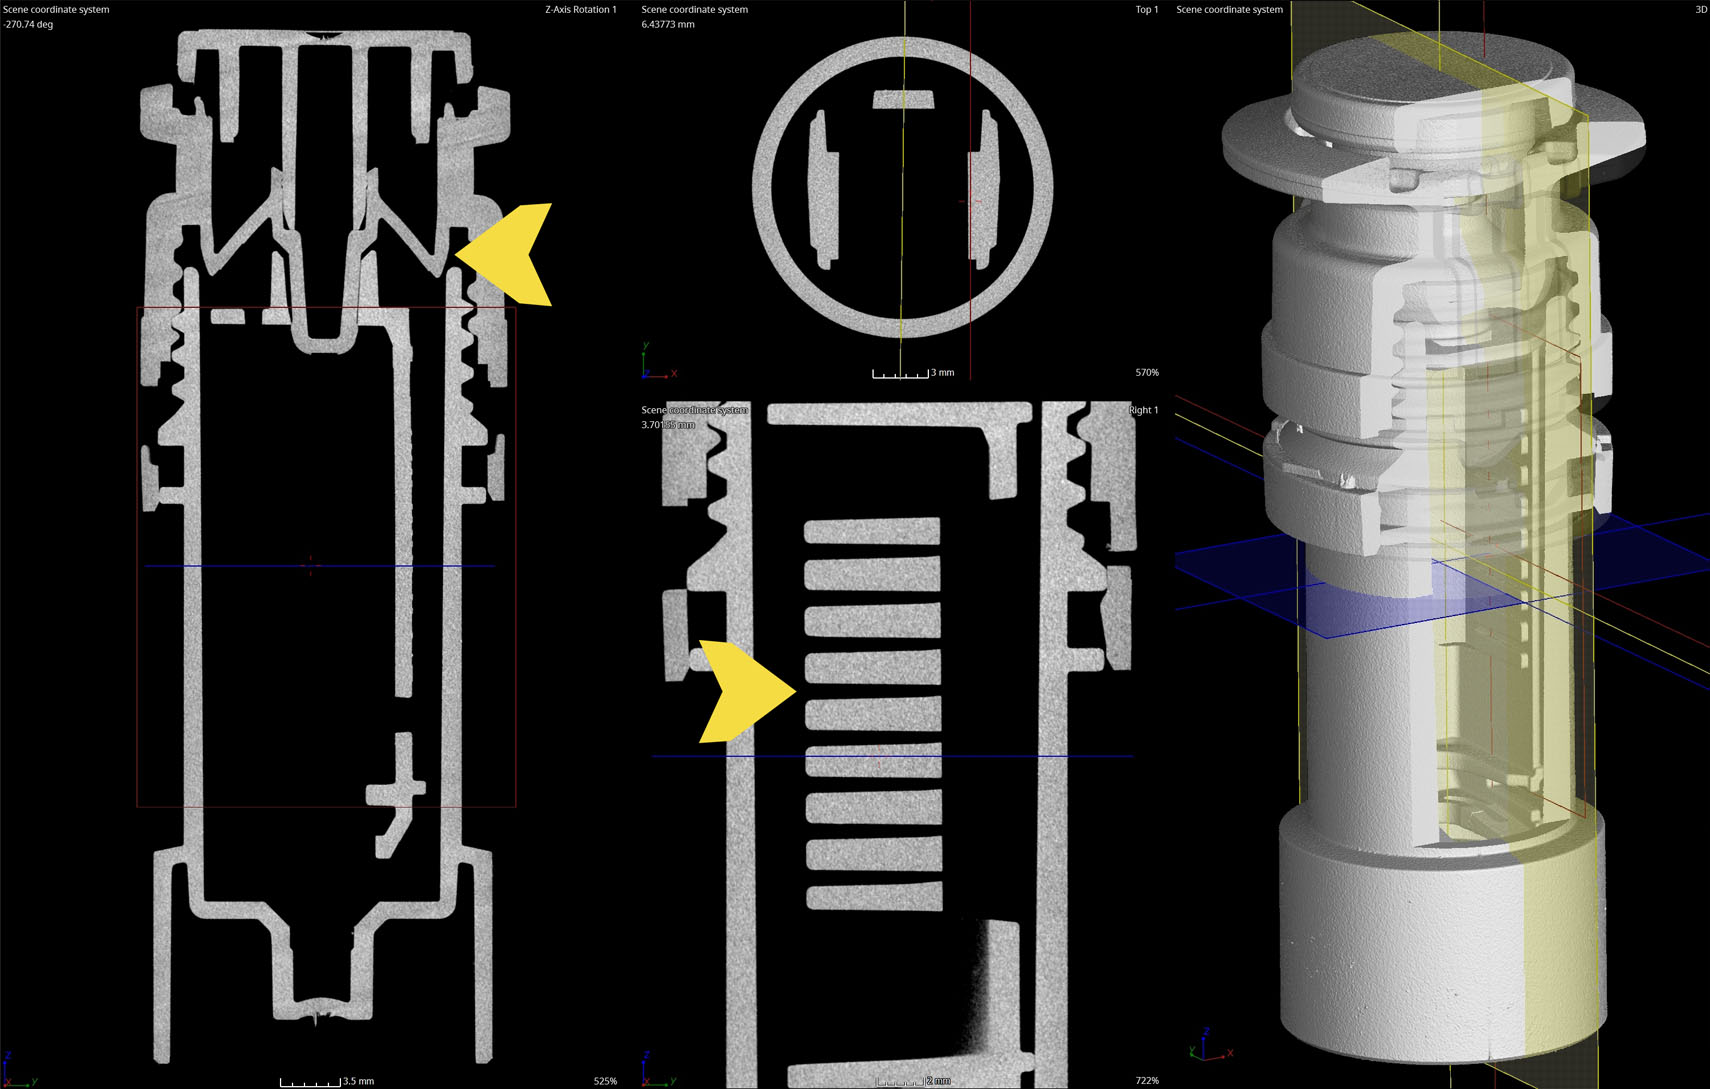
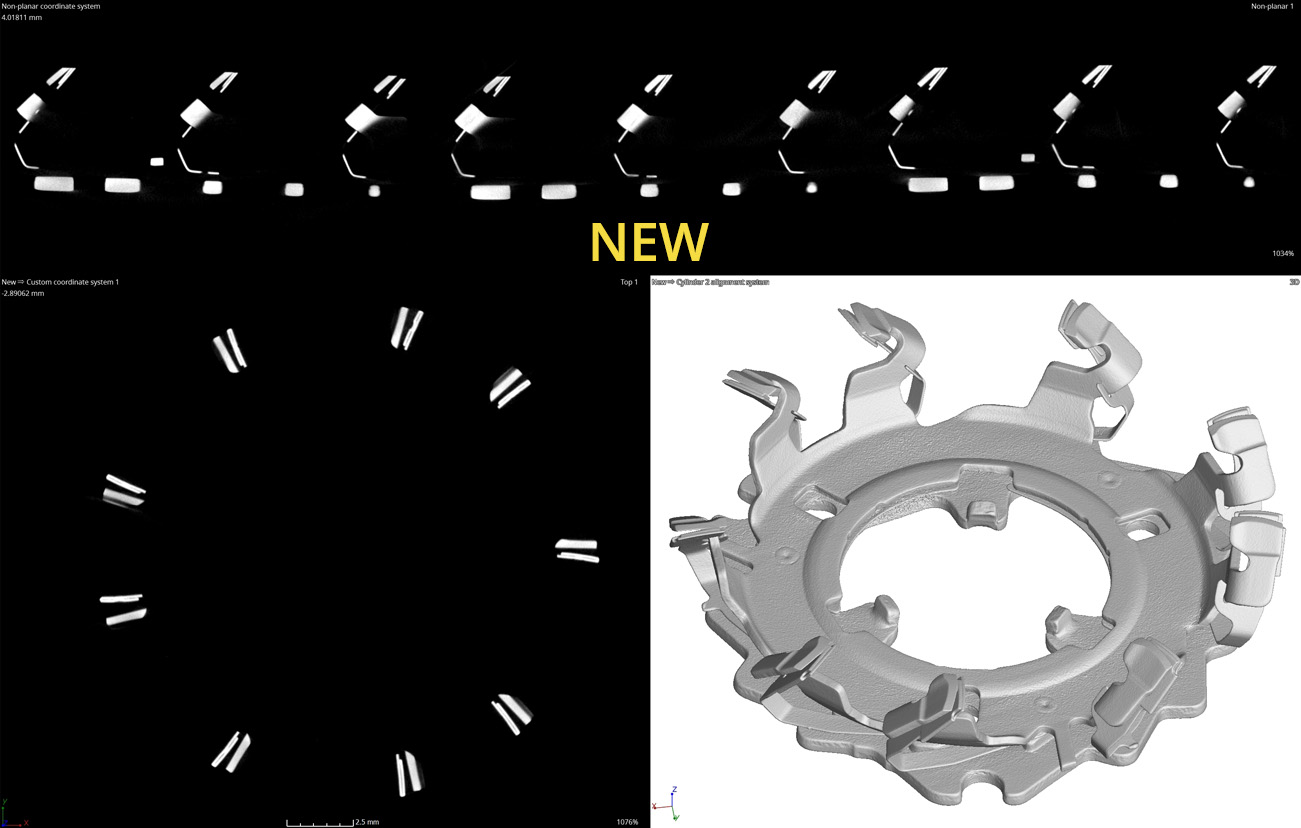
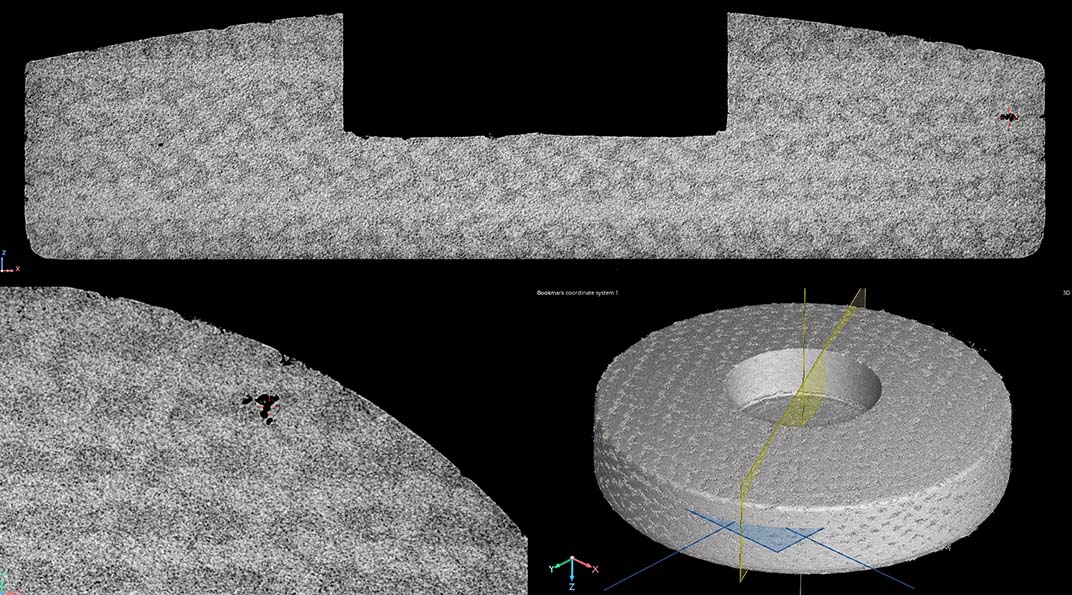
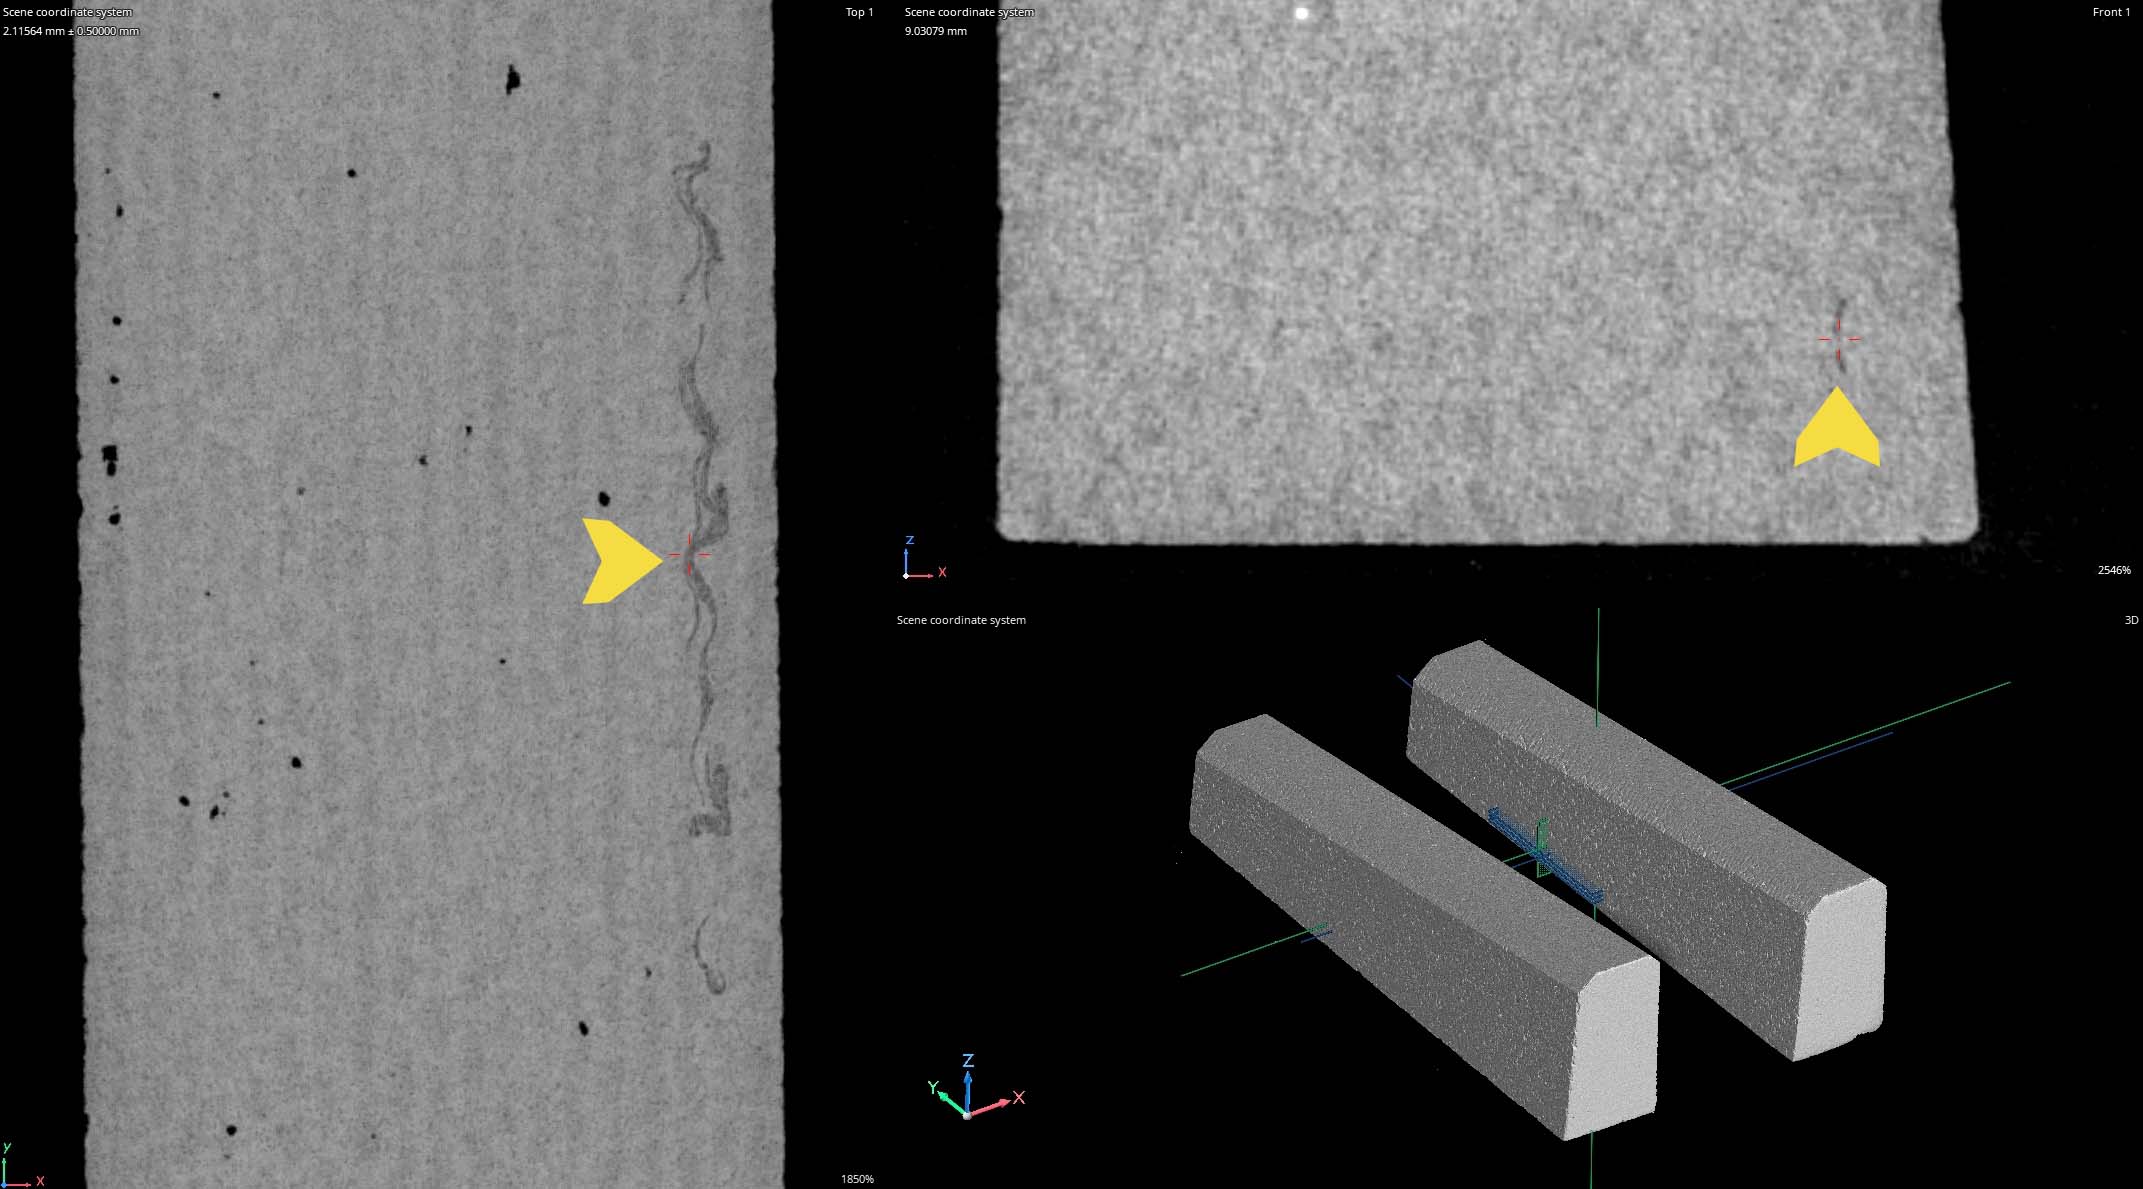
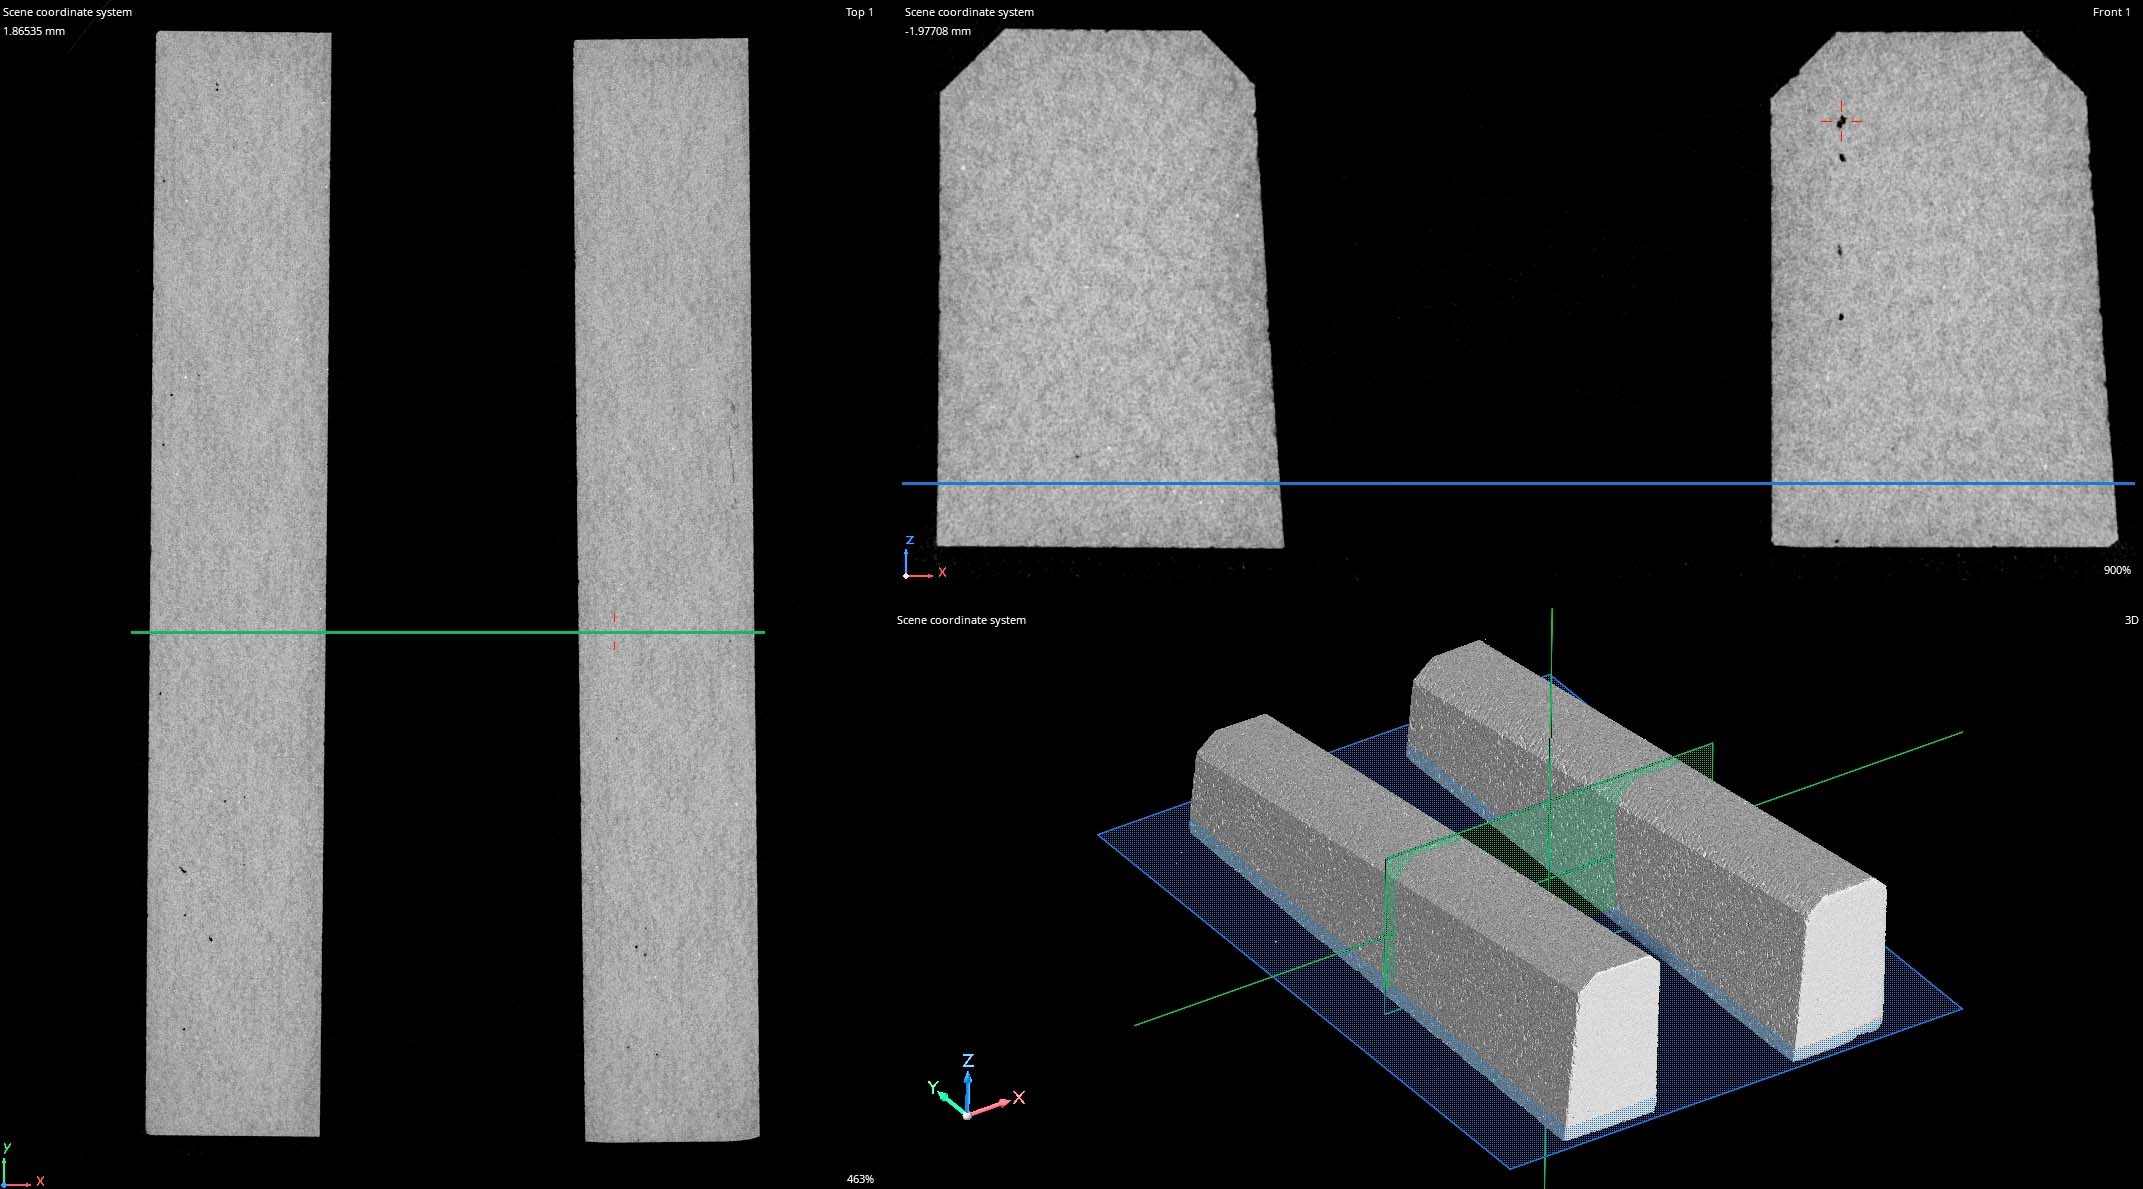
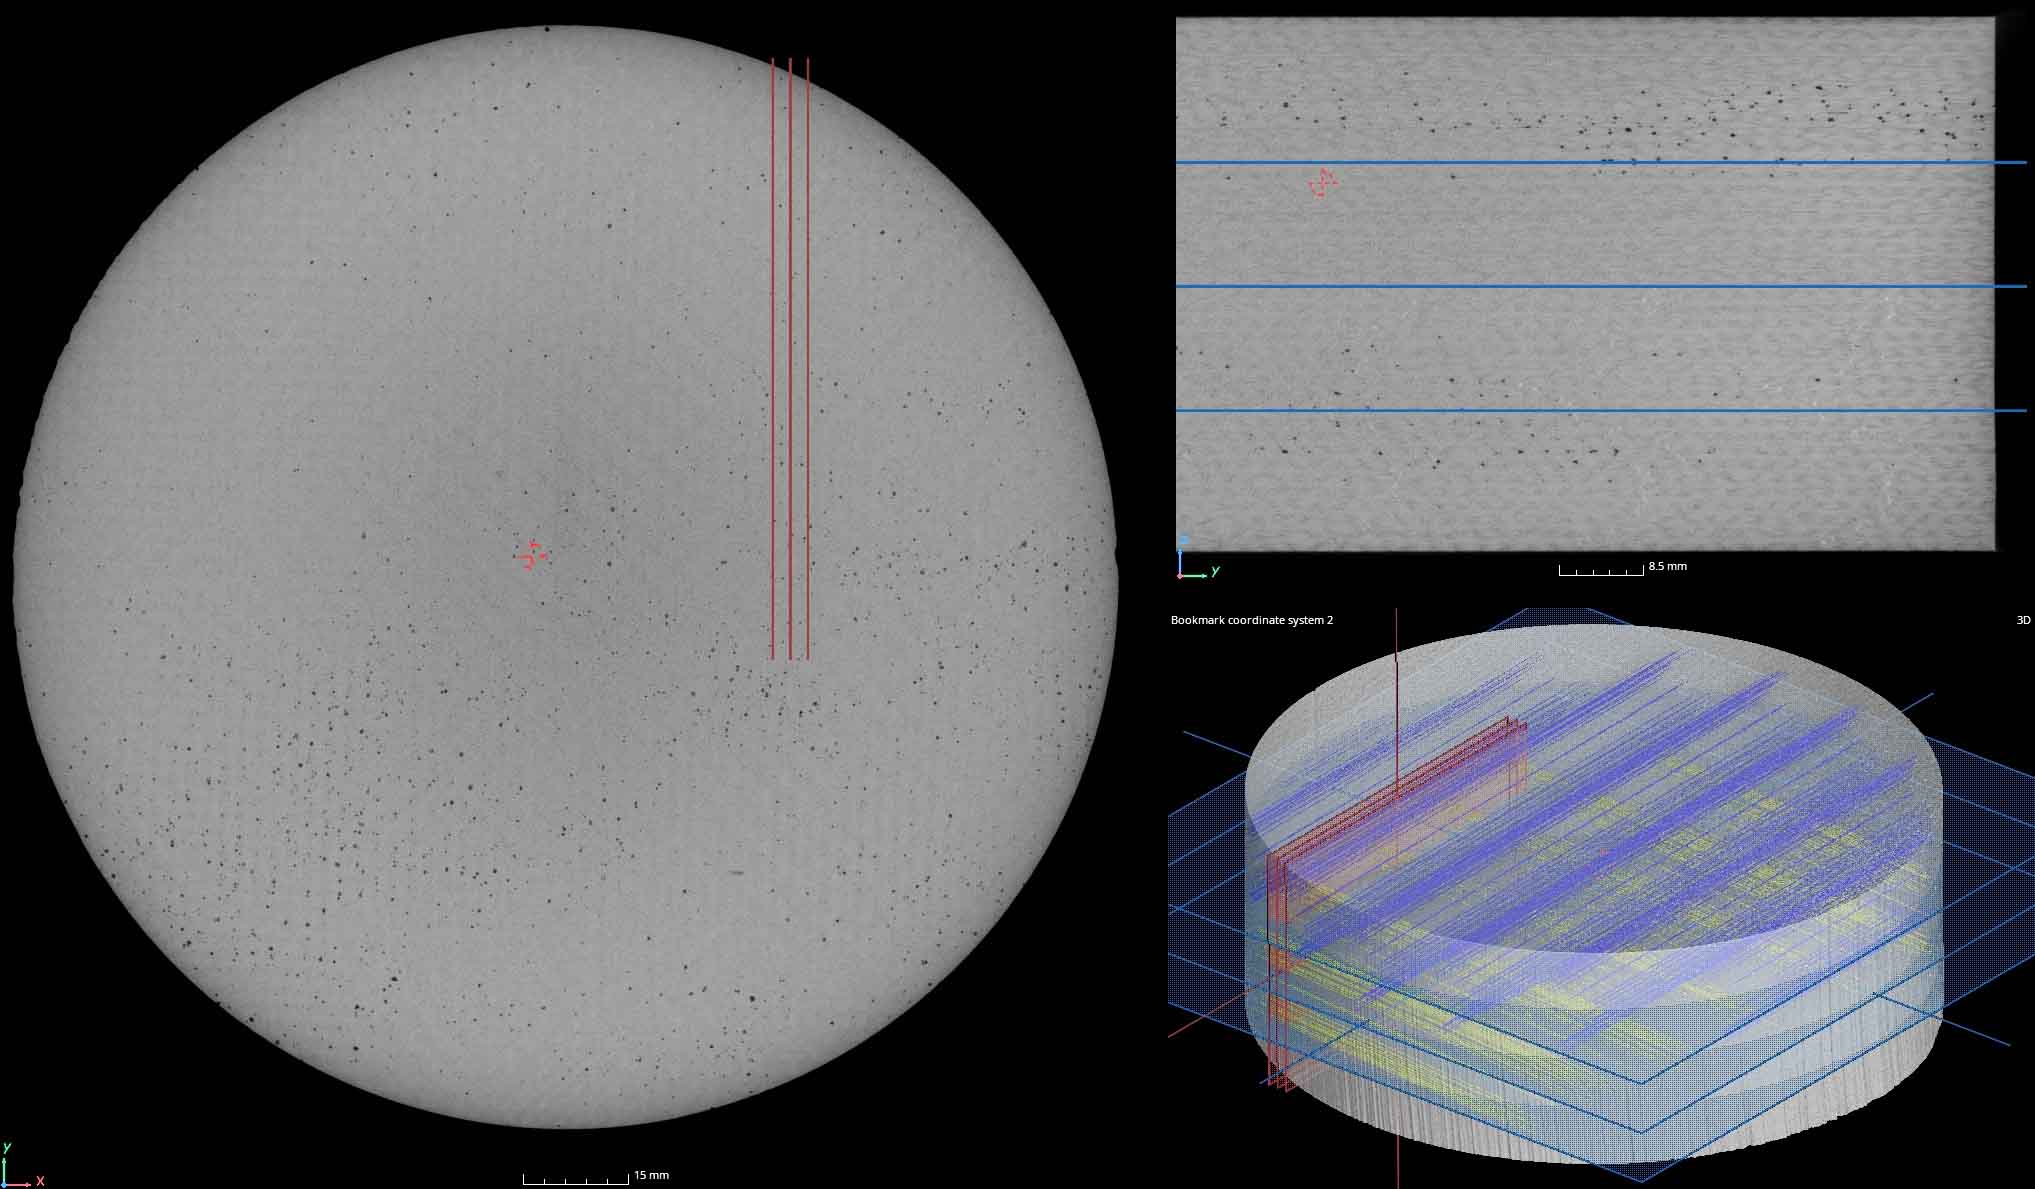
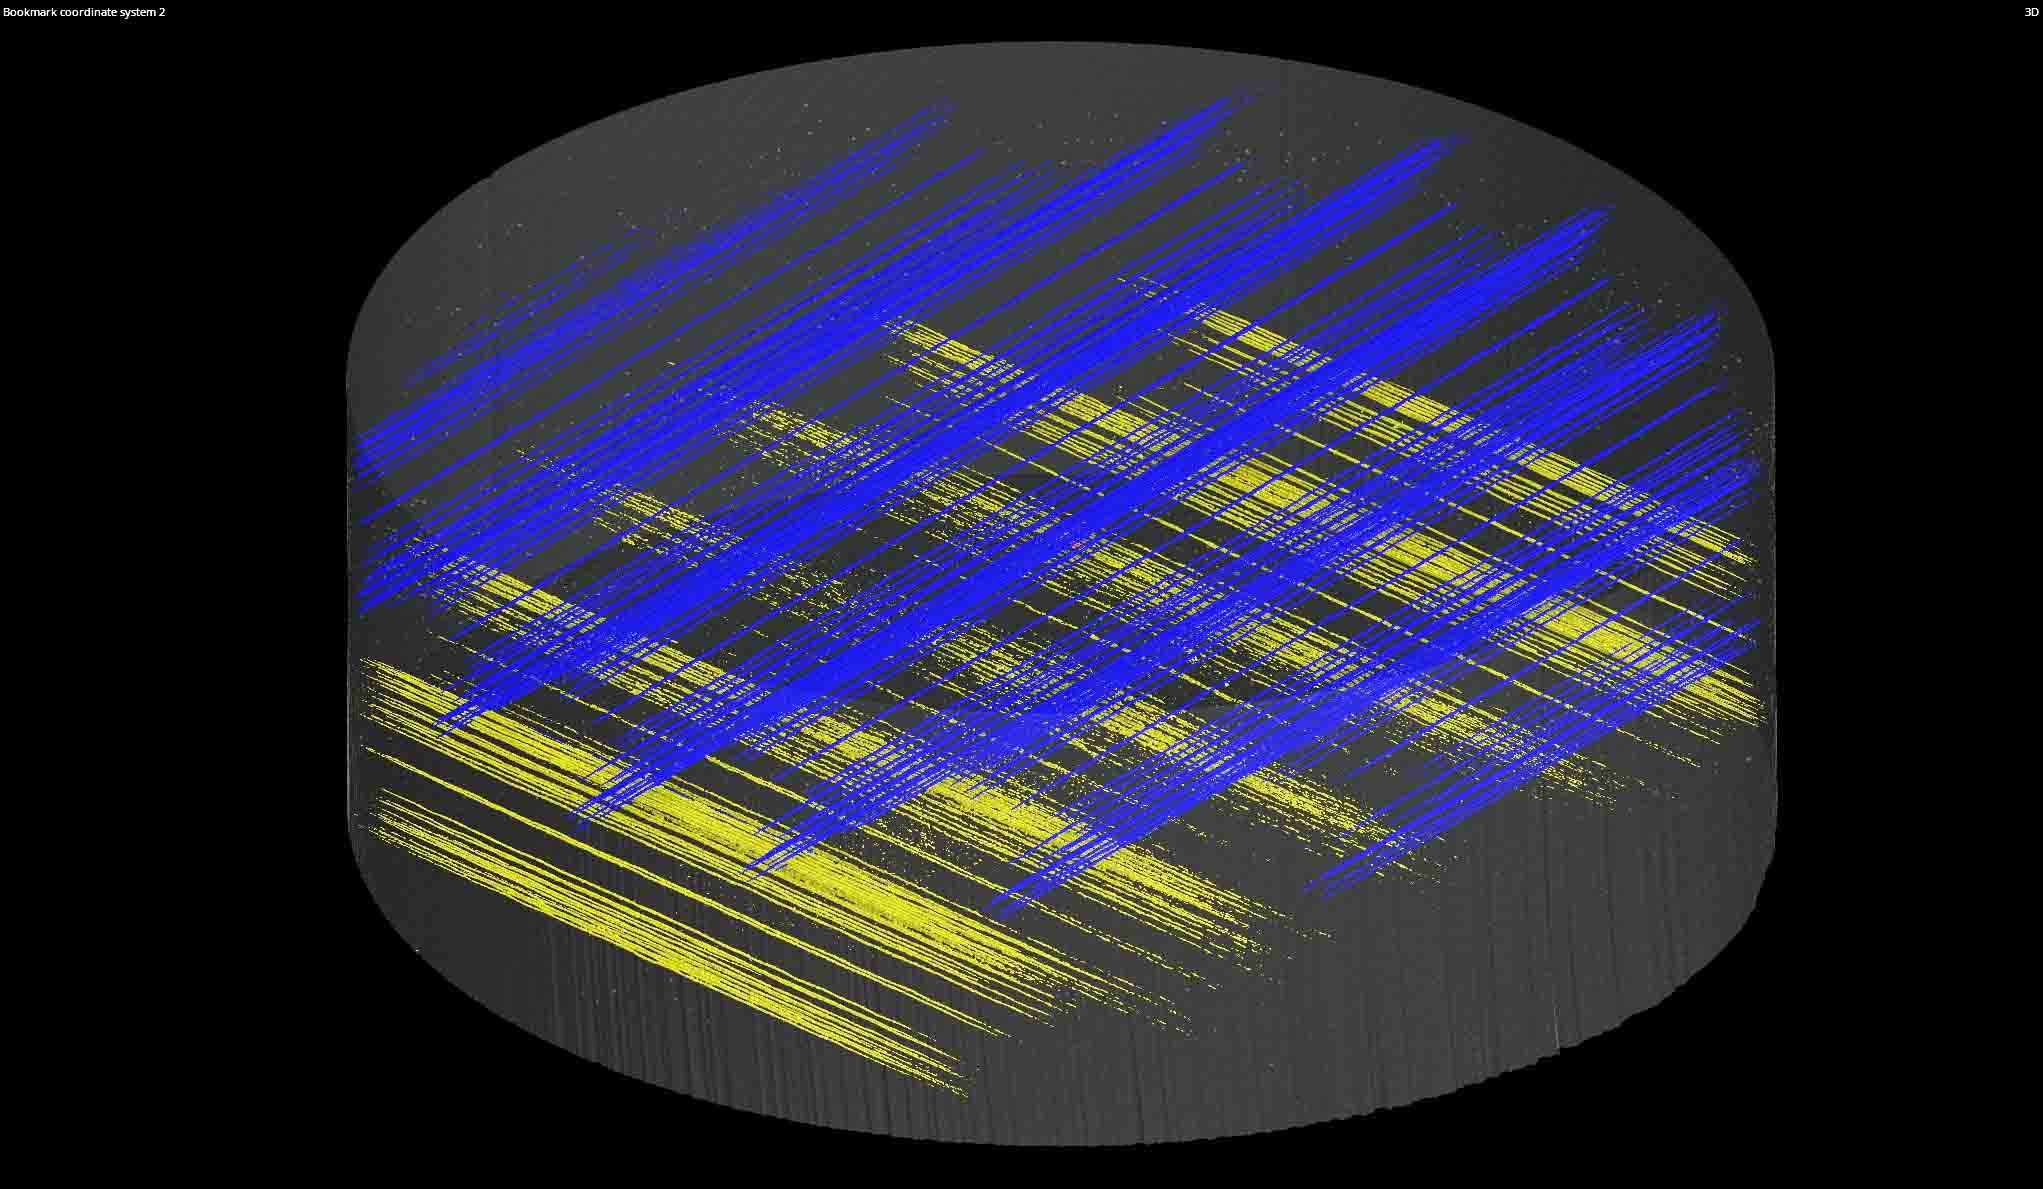
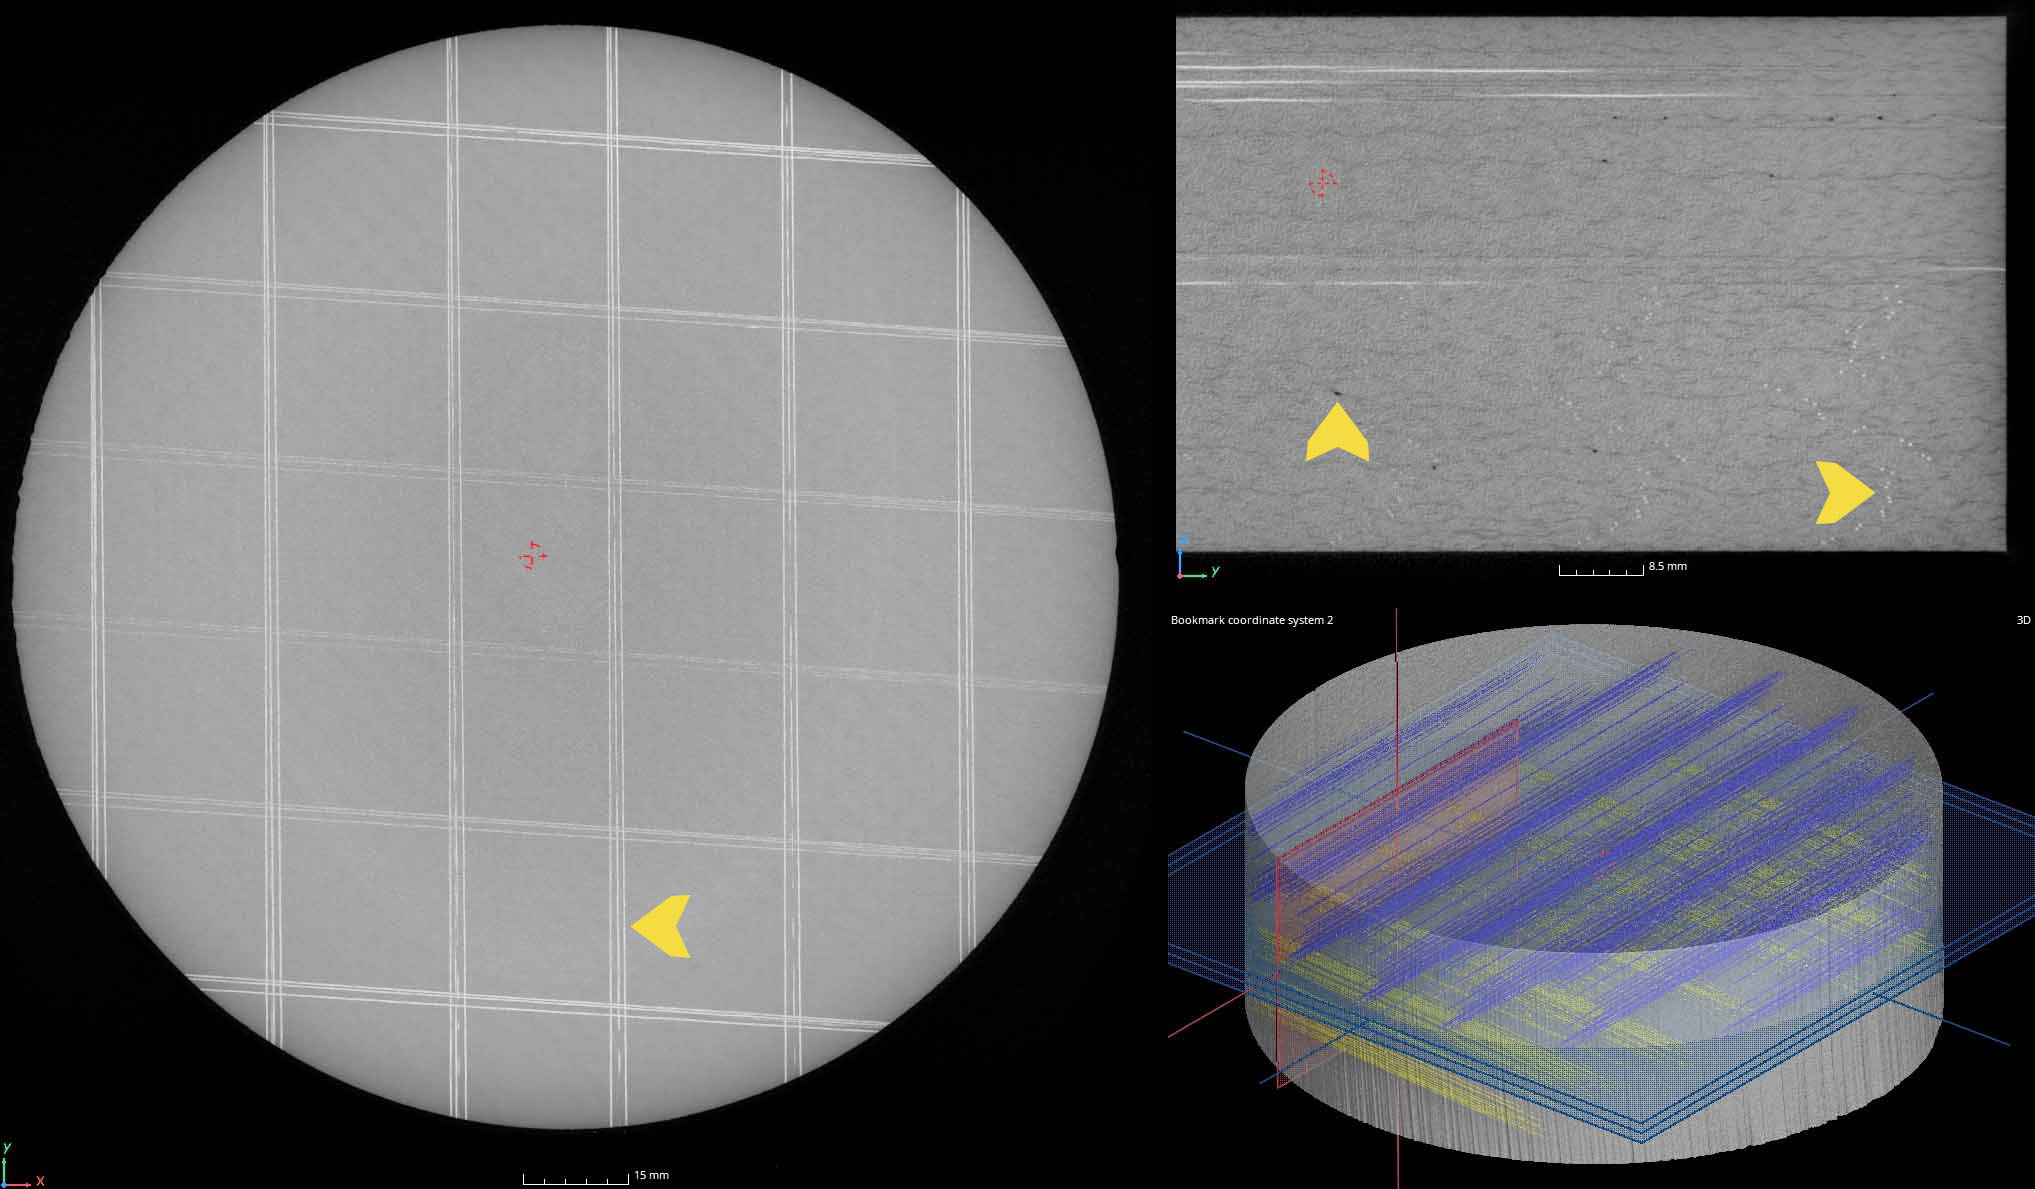
Micro-CT scanning allows us to inspect small components like stainless mesh filters for porosity, gaps, and overmold conditions.
Continue reading