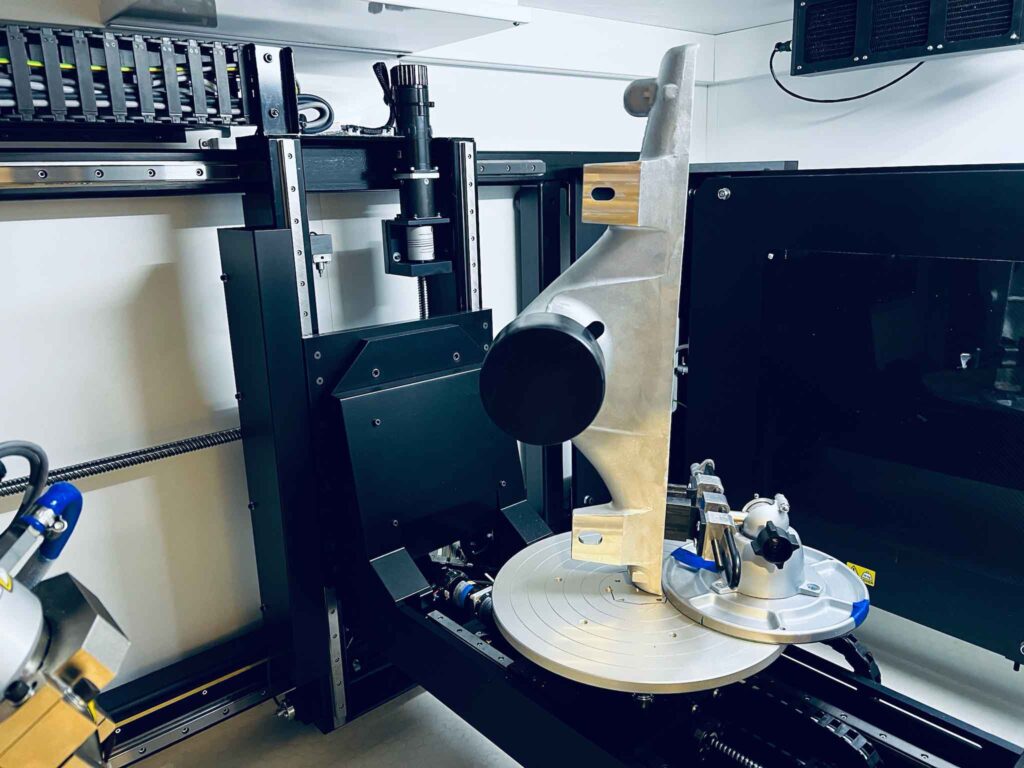
CT Scanning is used to quantify porosity within a part – whether it be plastics or metals. This information is useful for applications like process changes to reduce machining fallout or investigating failures like through wall leaks. As technology rapidly changes, large format, high energy CT systems paired with software packages like Volume Graphics can accommodate large and high density products.
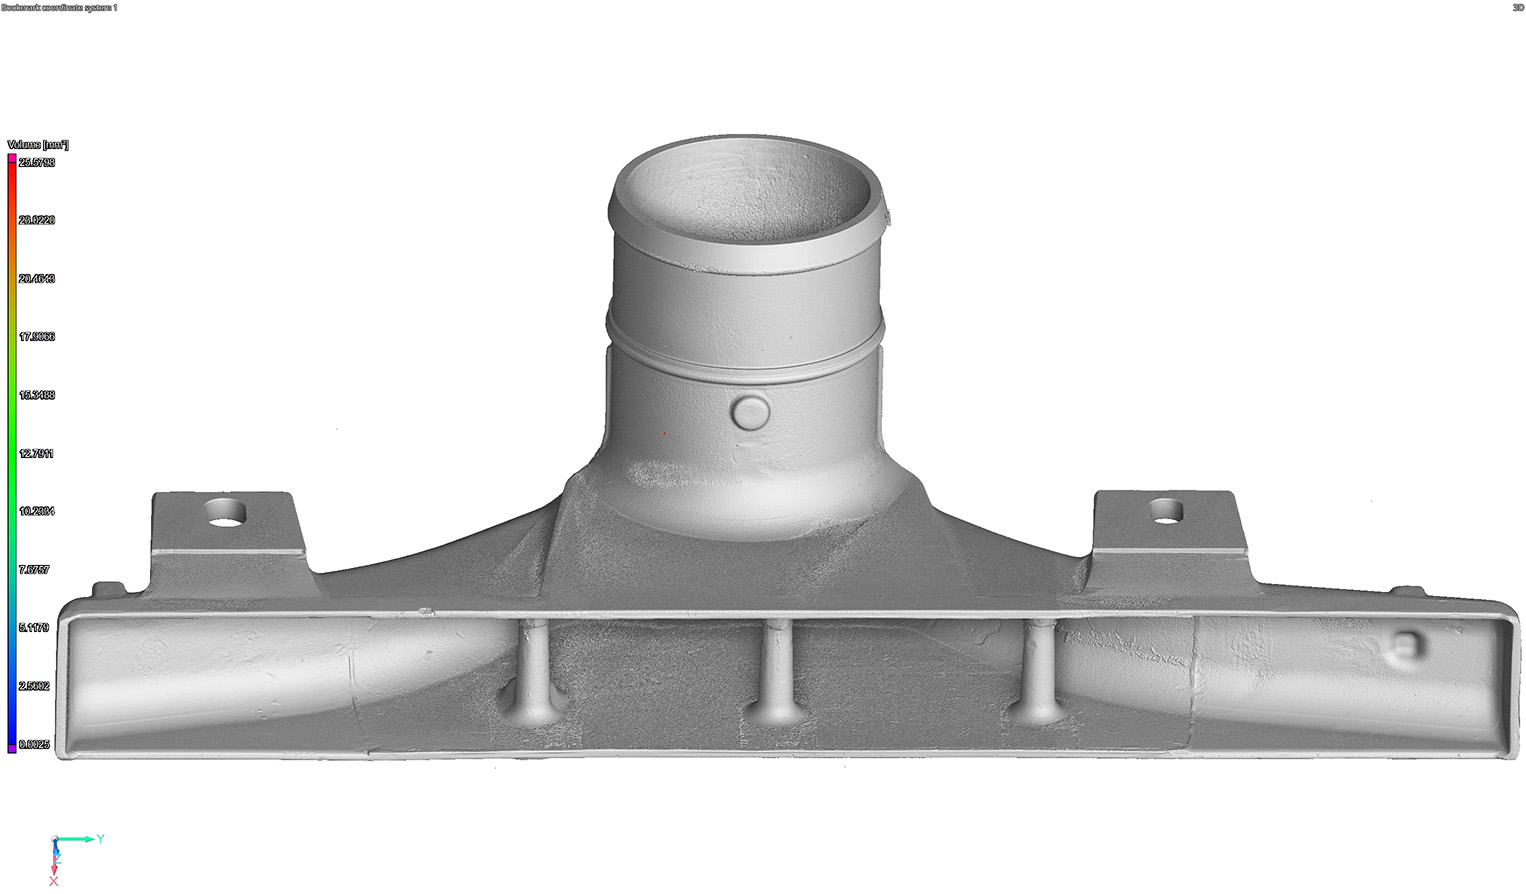
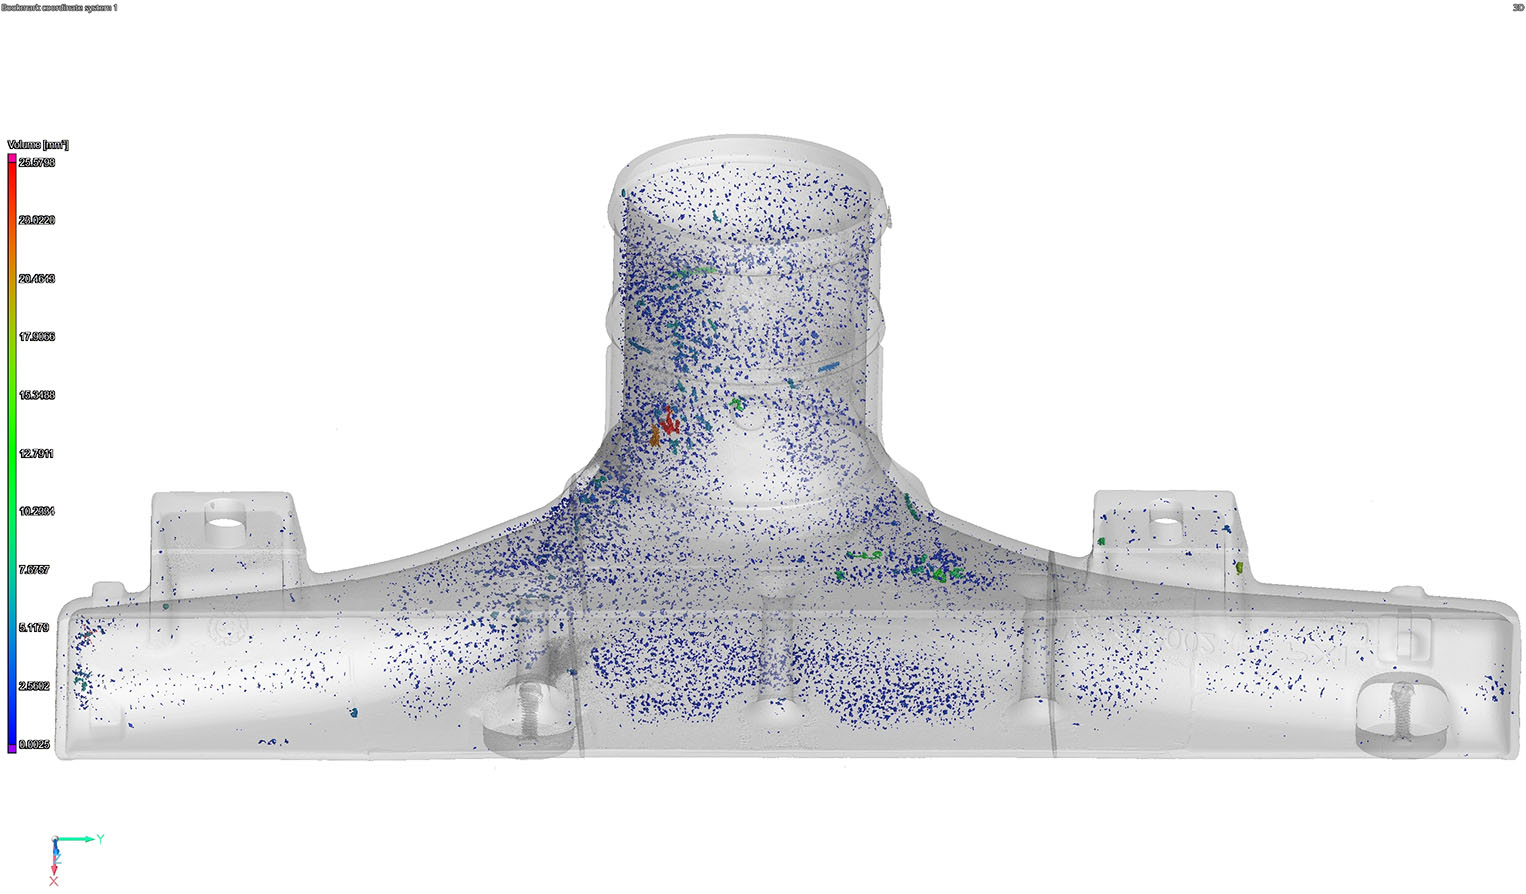
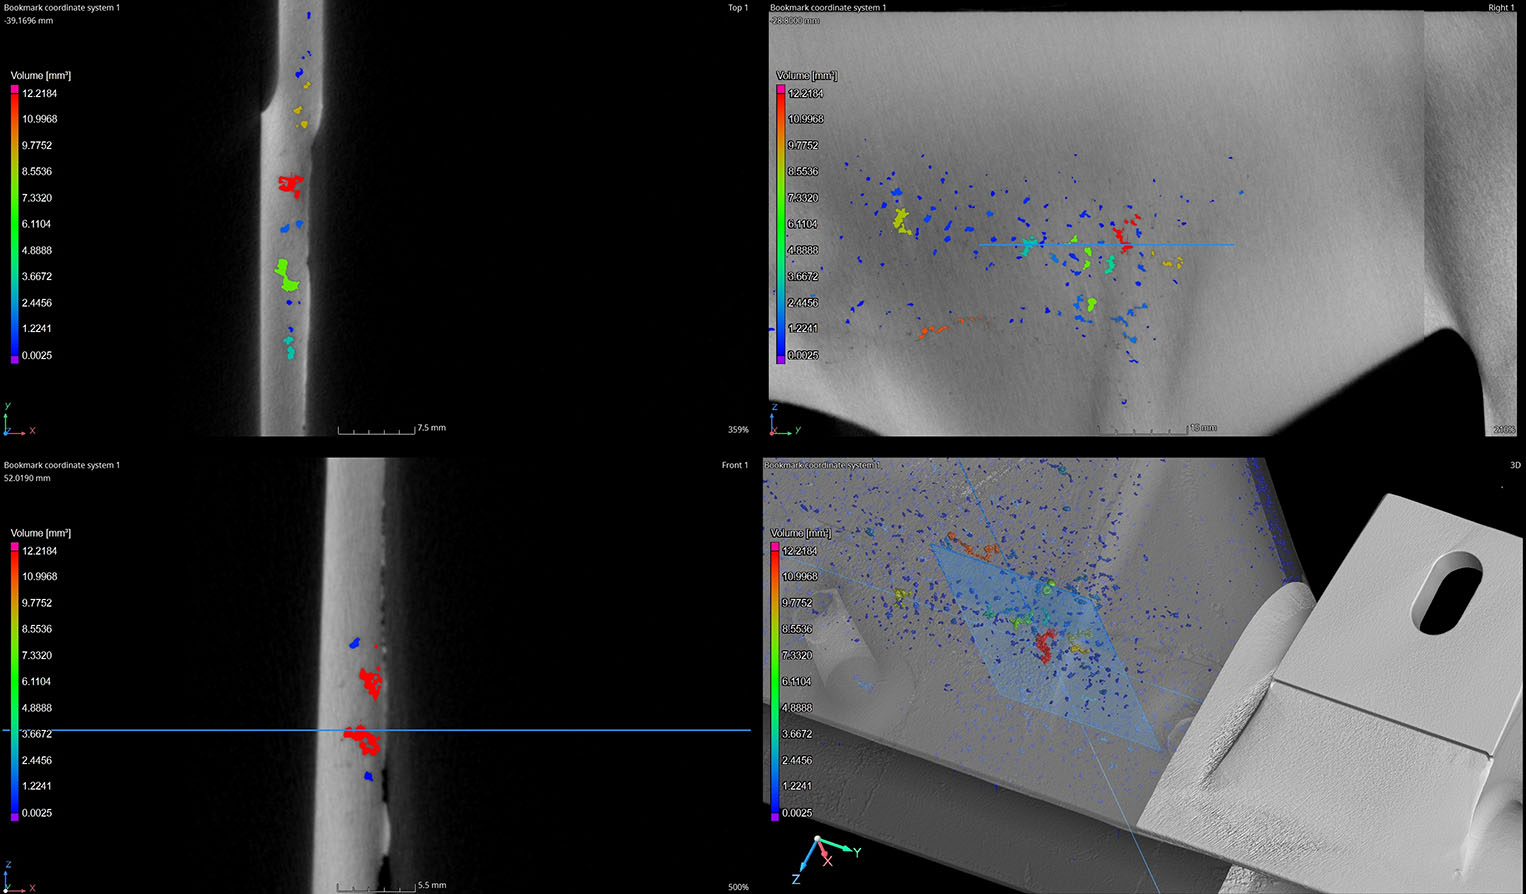
Unlike 2D X-Ray imaging, 3D CT Scanning can volumetrically quantify porosity. This quantification can be exported to Excel for statistical analysis to comare between manufacturing changes.
This large air cooler required four scans for total data acquisition. We then aligned and contrast adjusted the CT scans for a seamless review of the casting.
First Article Inspection (FAI) is a comprehensive verification process used in manufacturing to ensure that a newly produced part or component meets all specified requirements. It involves inspecting and testing the first production item against the engineering drawings, specifications, and other applicable standards.
FAI typically involves detailed inspections, measurements, and testing to verify critical dimensions, material properties, functionality, and performance characteristics of the part.
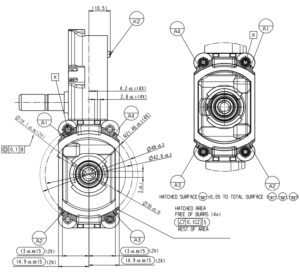
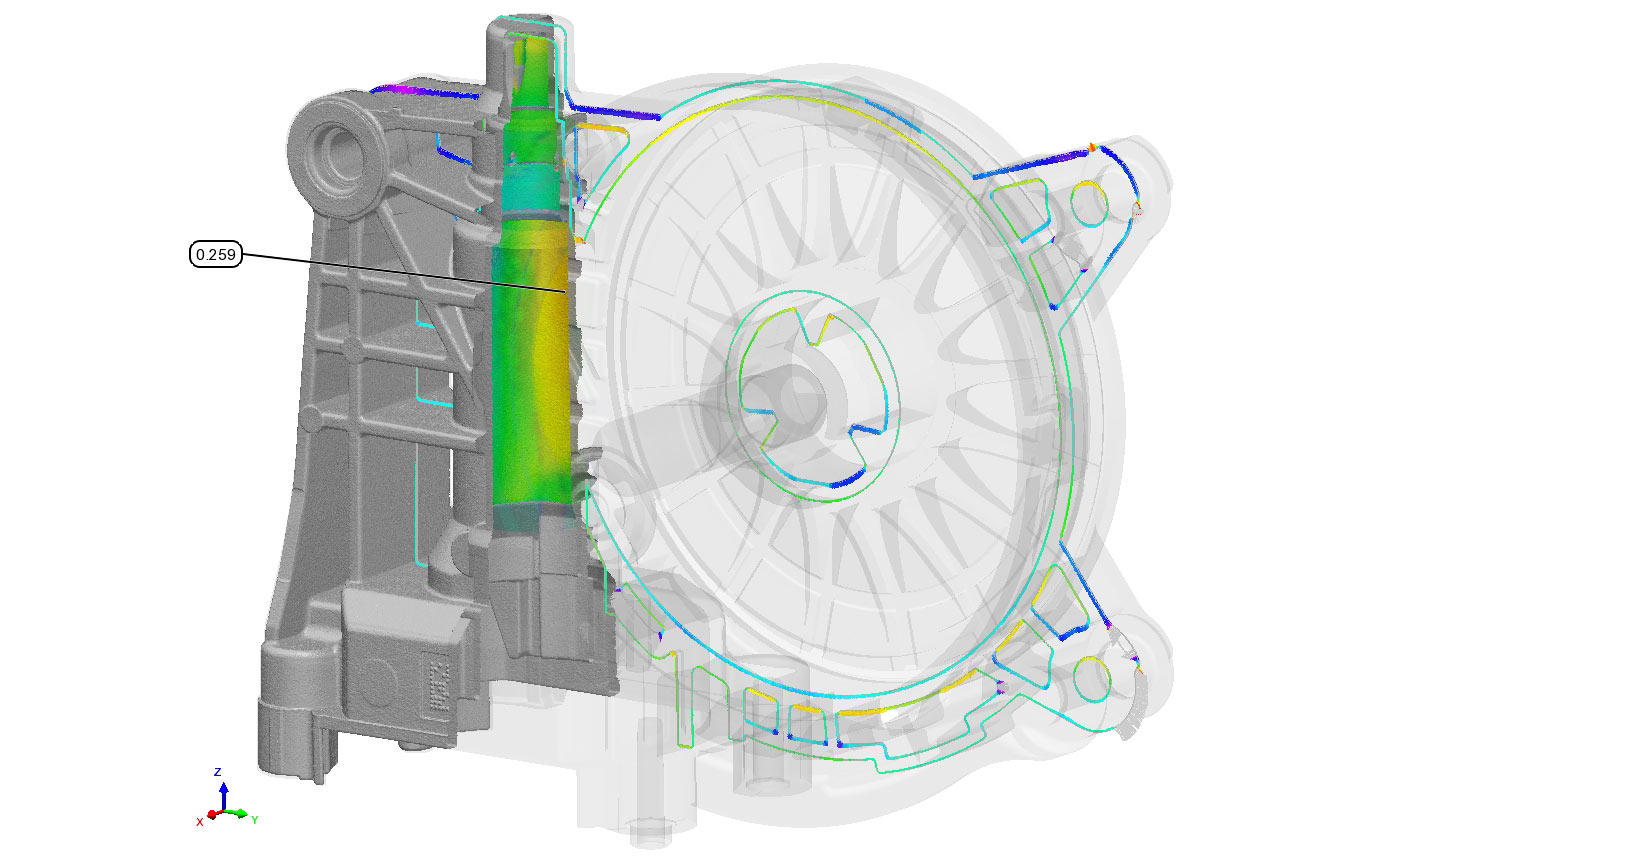
3D PROFILING
3D scanning is the process of creating a three-dimensional representation of an object. This representation is in the form of a scan file which can be compared to the perfect design model. The profile comparison heat map allows inspectors and manufacturers to identify defects, deviations, or areas of concern. The scale can be set to any tolerance:
Green to Red represents material “above” CAD surfaces
Green to Blue represents material “below” CAD surfaces
Gray represents geometry outside of the tolerance band
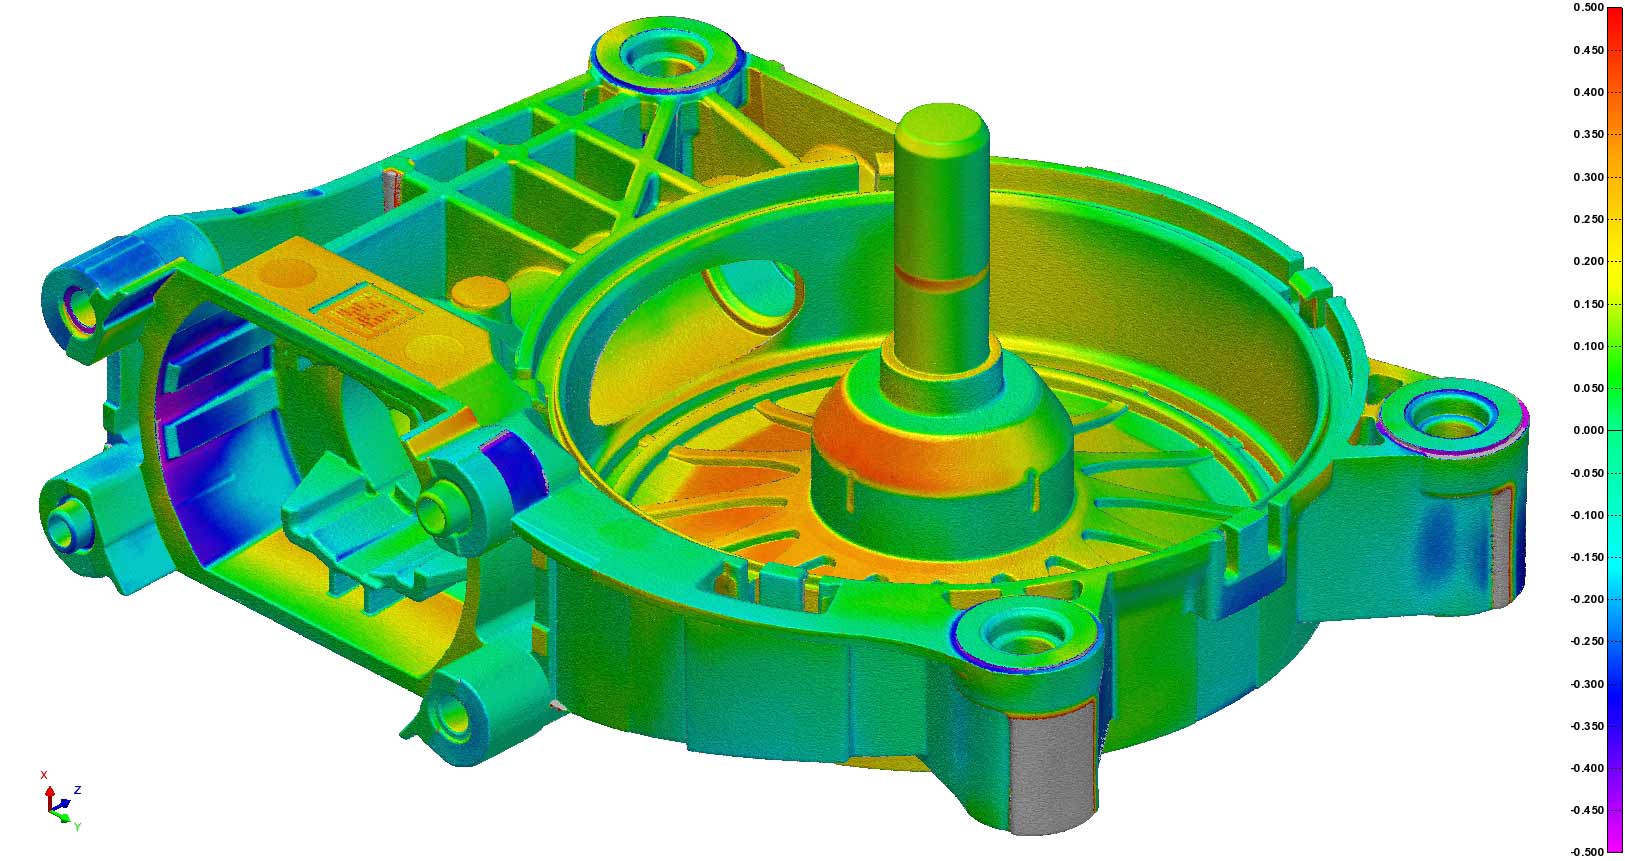
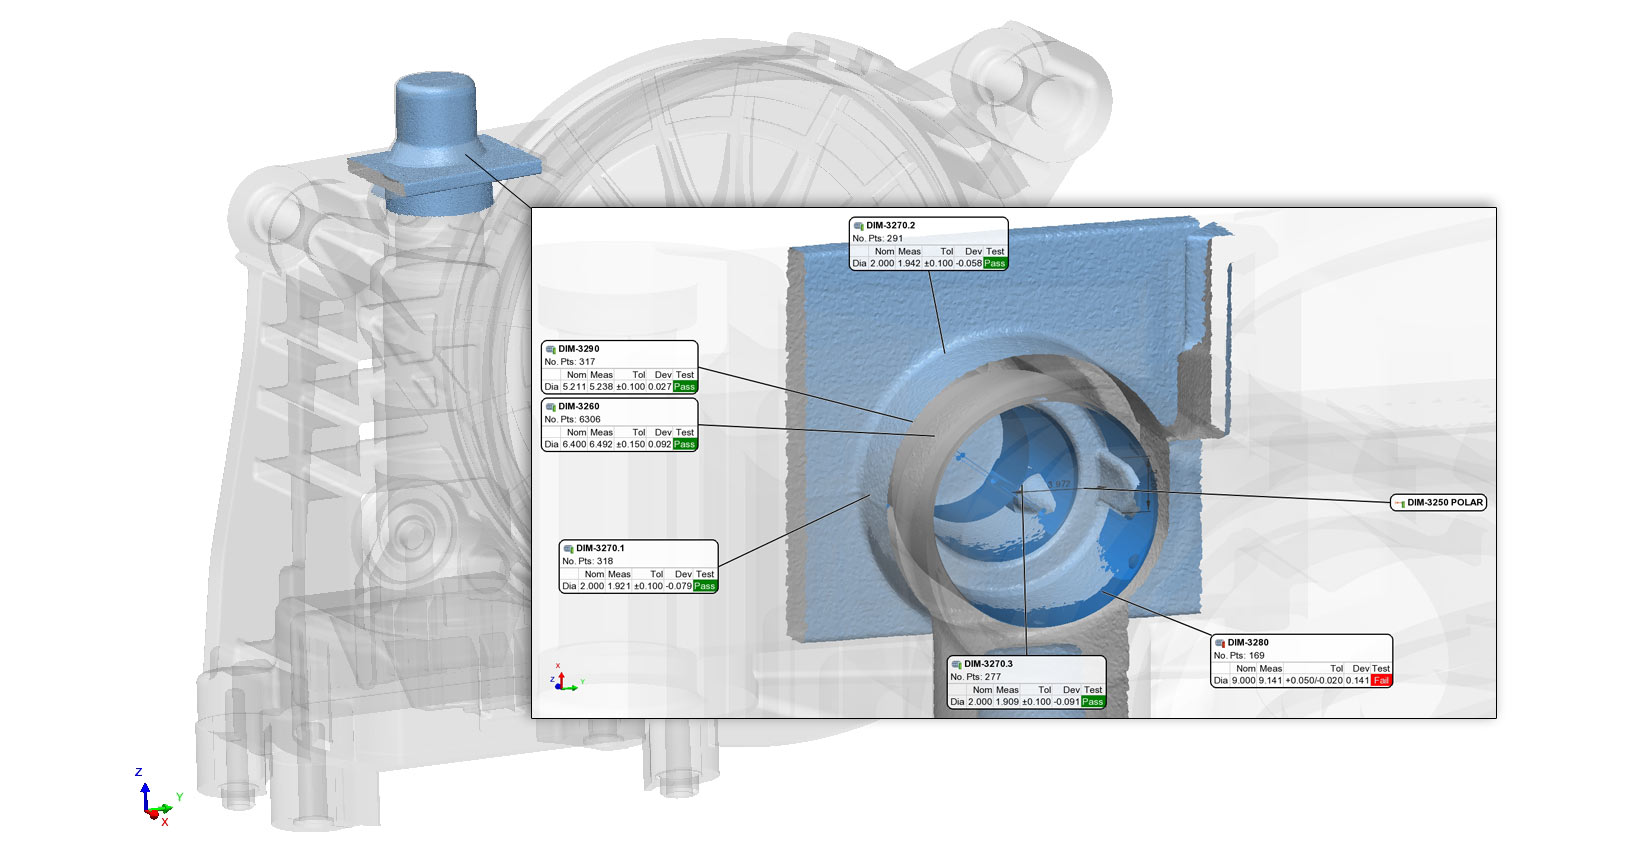
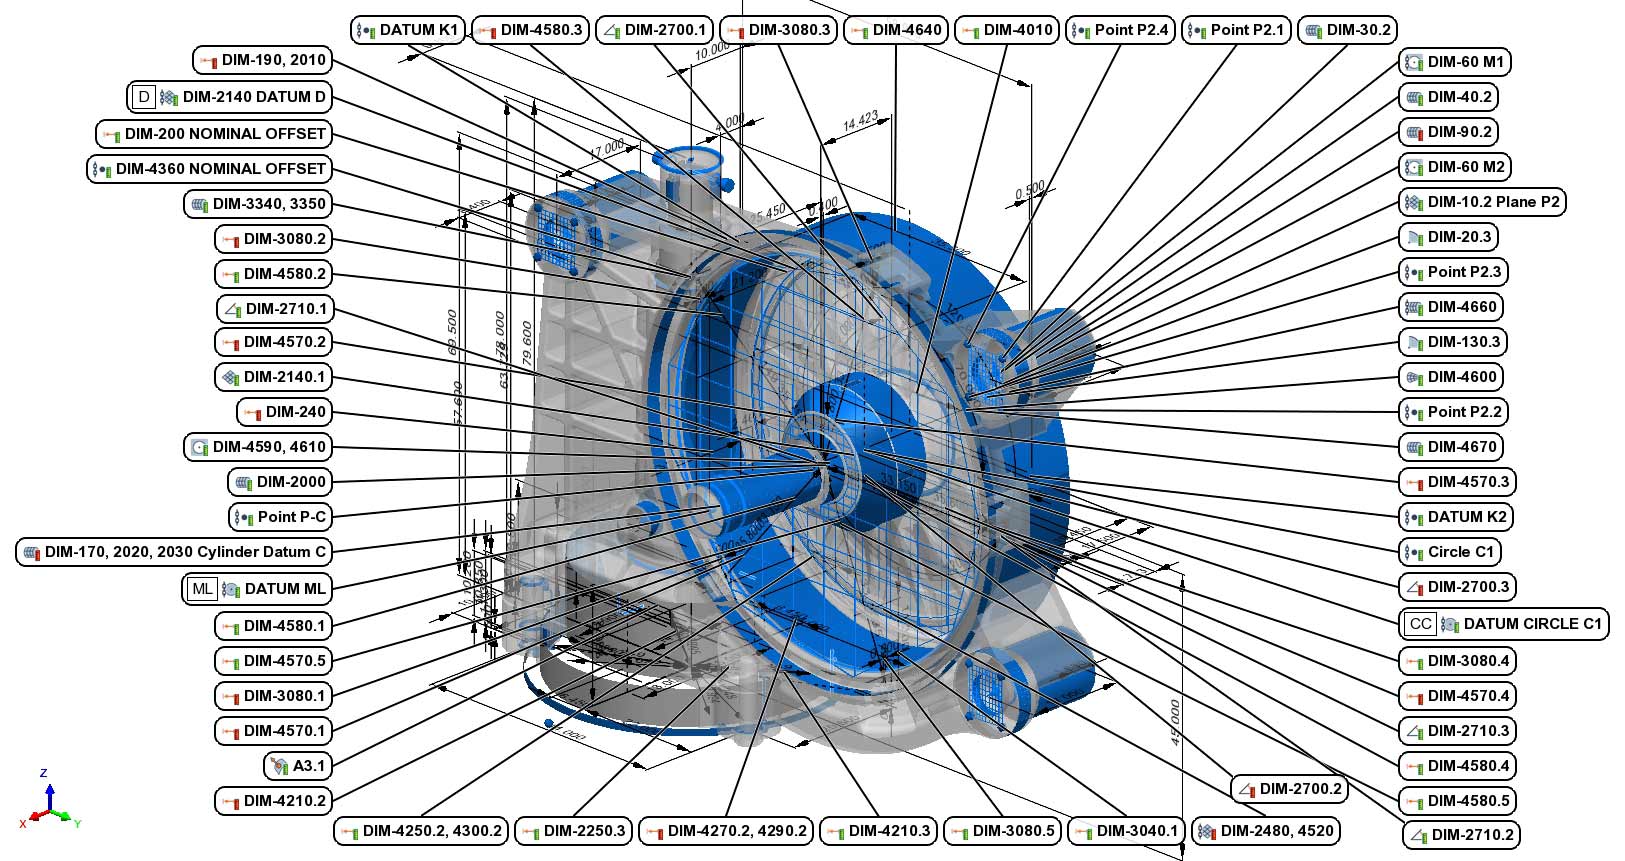
DIMENSIONAL INSPECTION
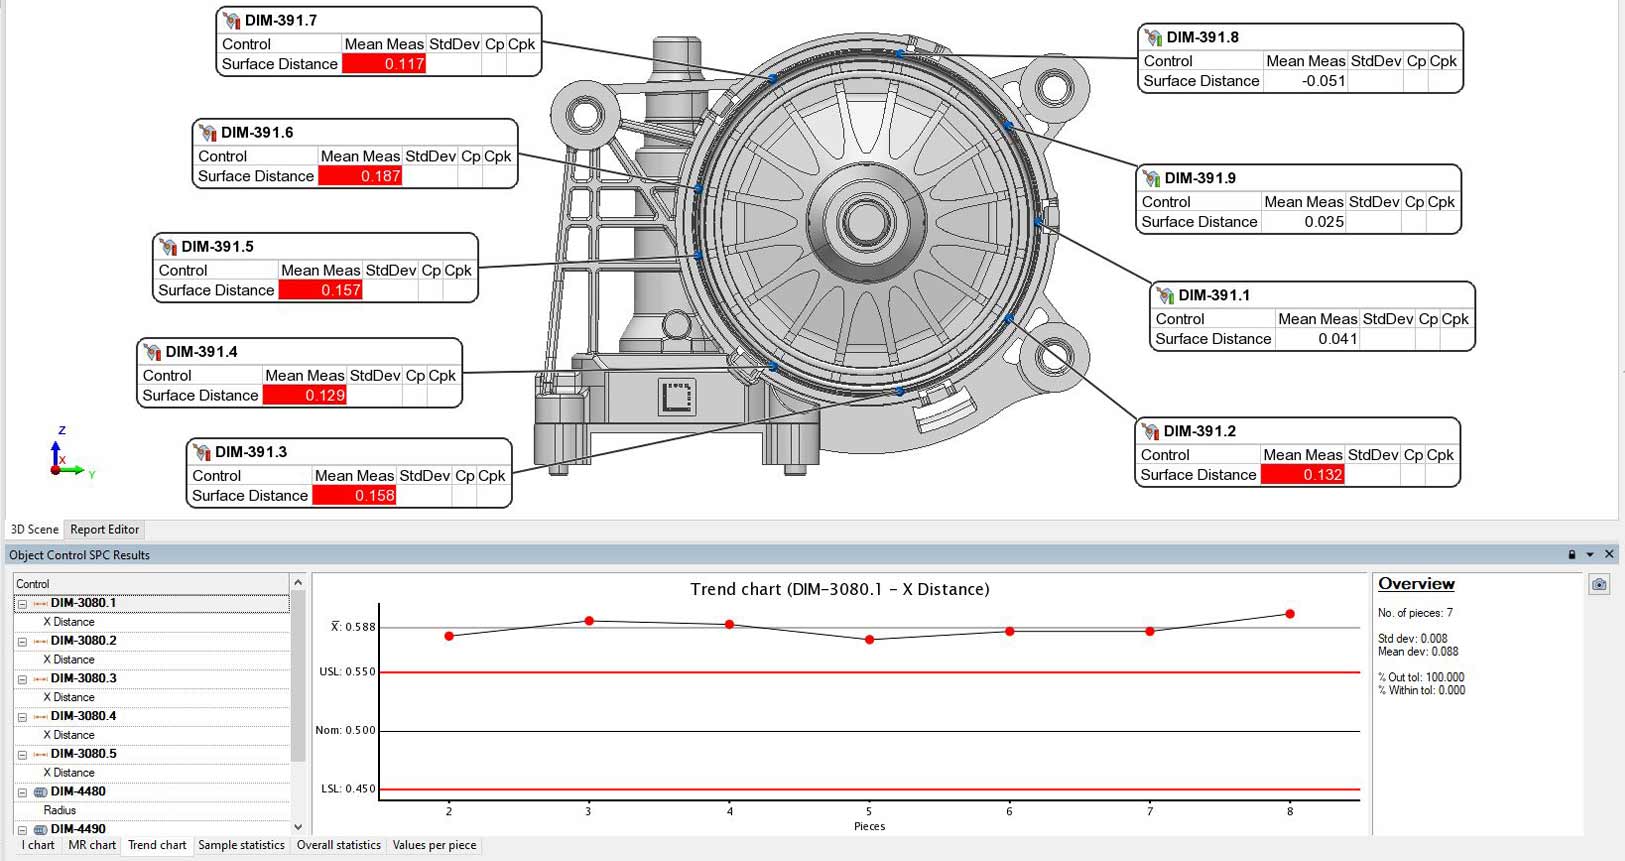
Dimensional inspection involves measuring various dimensions, such as distances, diameters, angles, complex GD&T like true positions, concentricity, and runout. These controls are used to ensure products conform to the design specifications and tolerances provided by engineering drawings.
We use PolyWorks Metrology Suite for programming, automated inspection, SPC evaluation, and imaging.
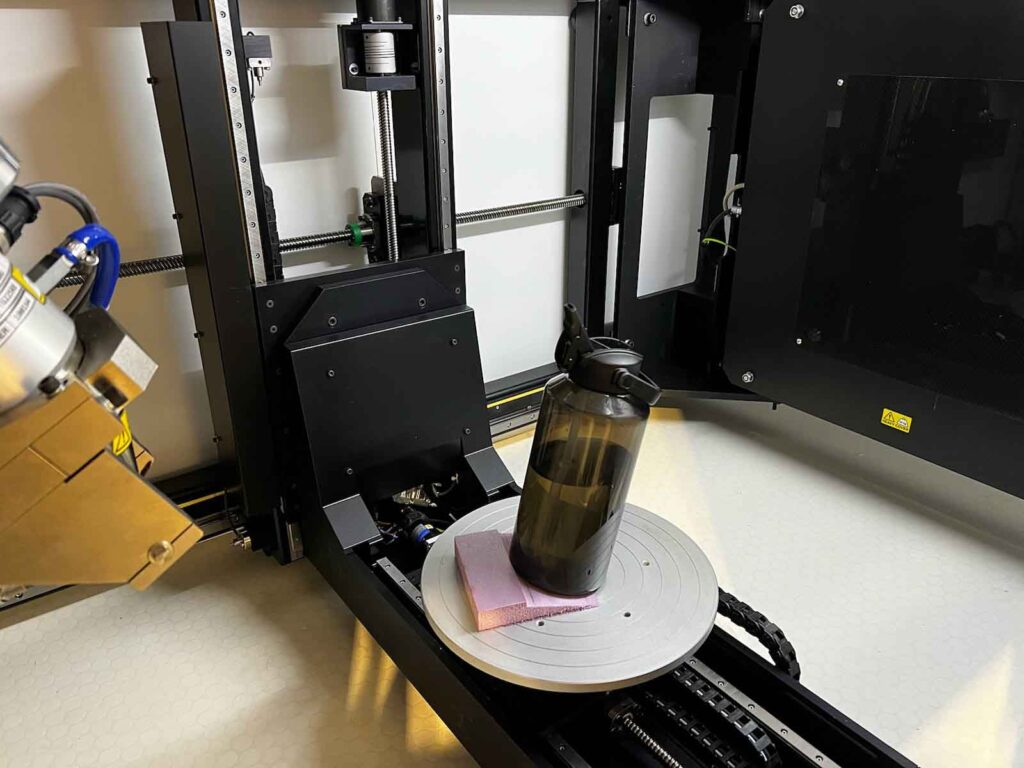
Step scanning, often referred to as “4D CT”, is the process of collecting several CT datasets at various product conditions, aligning those datasets to a common datum reference frame, and saving images to demonstrate product changes.
This practice is commonly used for parts or products that actuate or have several functioning positions. For example, this water bottle has multiple sealing interfaces that change depending on the valve / straw configuration. Perhaps a leak forms when the valve is at a specific angle, but not when the spout is fully closed or open.
Axially rotating clips about a part are also useful for inspecting an entire gasket to groove relationship.
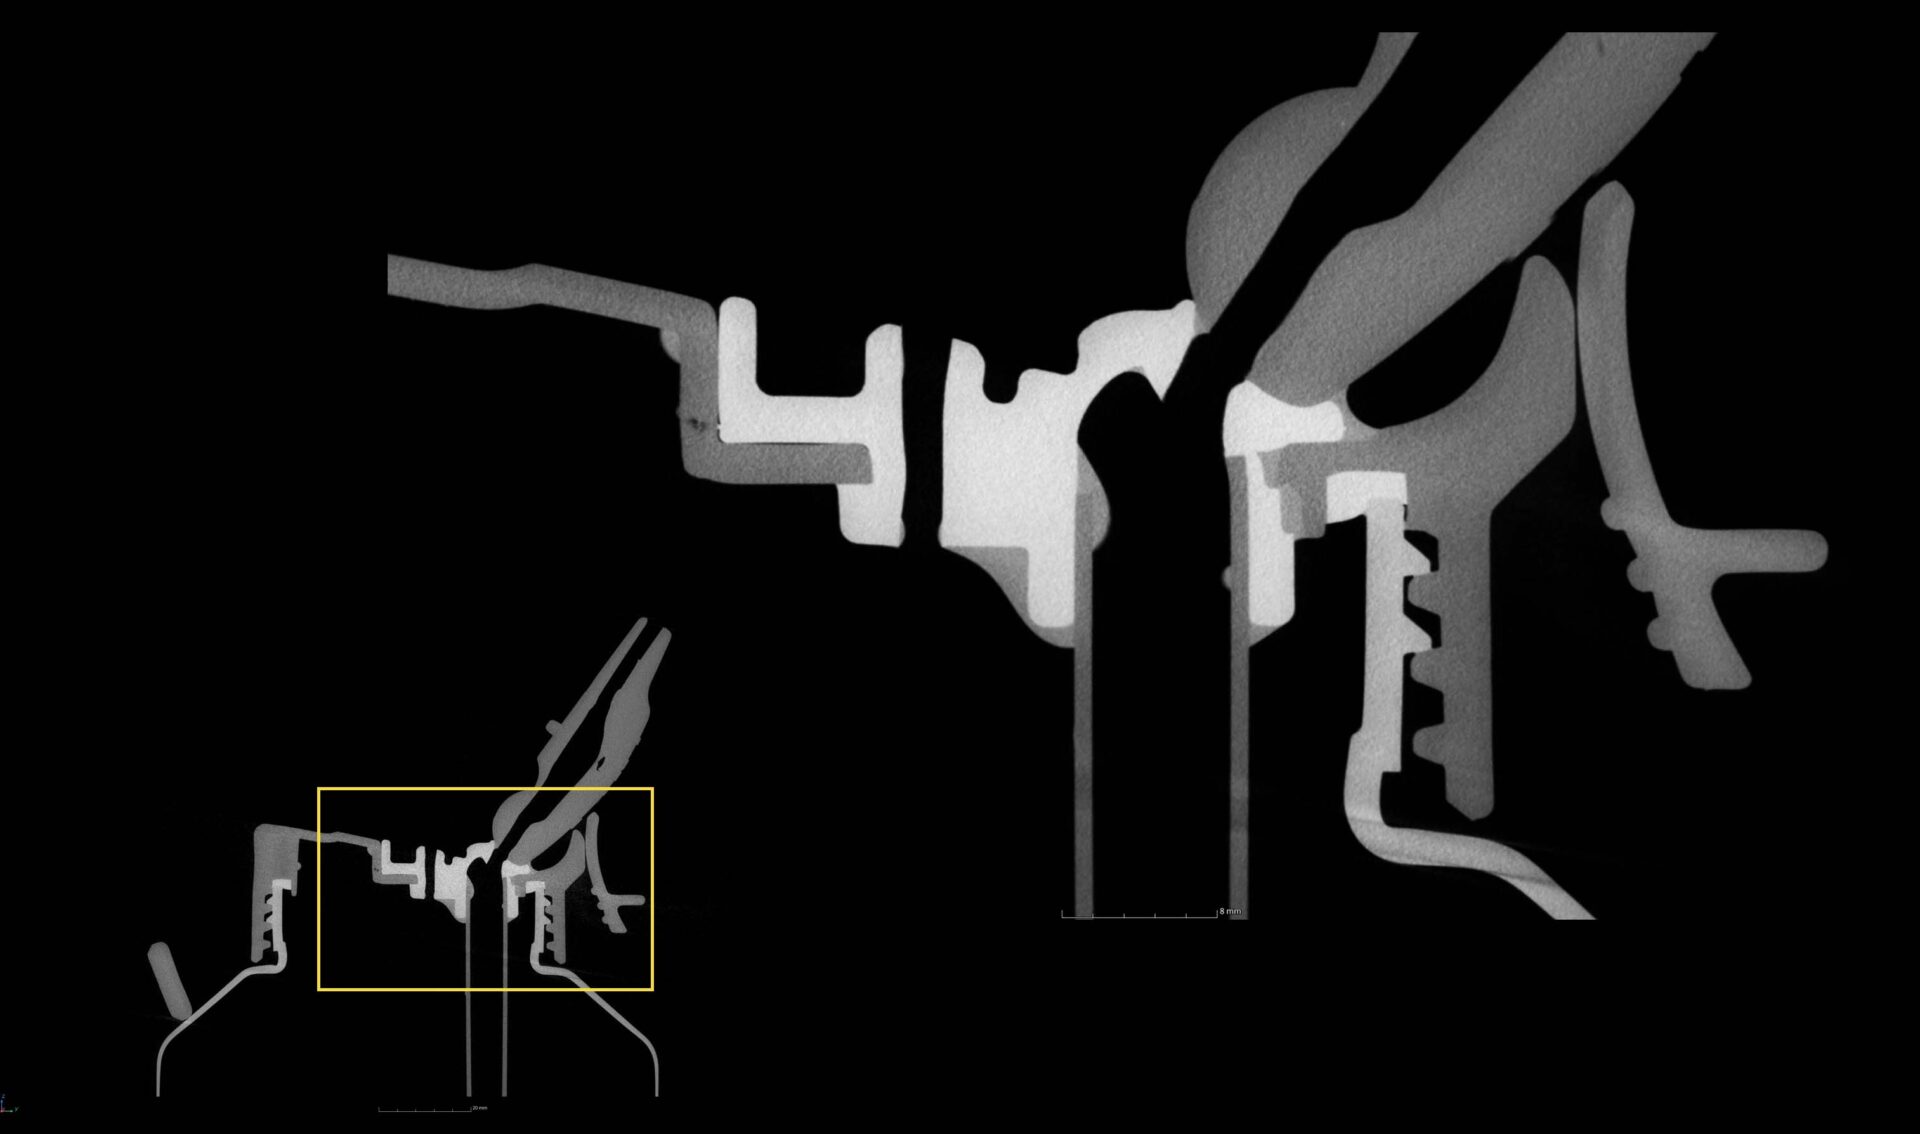
HIGH RESOLUTION CT SLICE IMAGING
CT slice imaging can be measured in Volume Graphics or exported to .stl for use in other softwares for dimensional inspection in PolyWorks, or FEA in Ansys. Scrolling through the part allows us to quickly detect voids, measure wall thickness, locate gaps between materials, and characterize leak paths. pinches, or cracks.
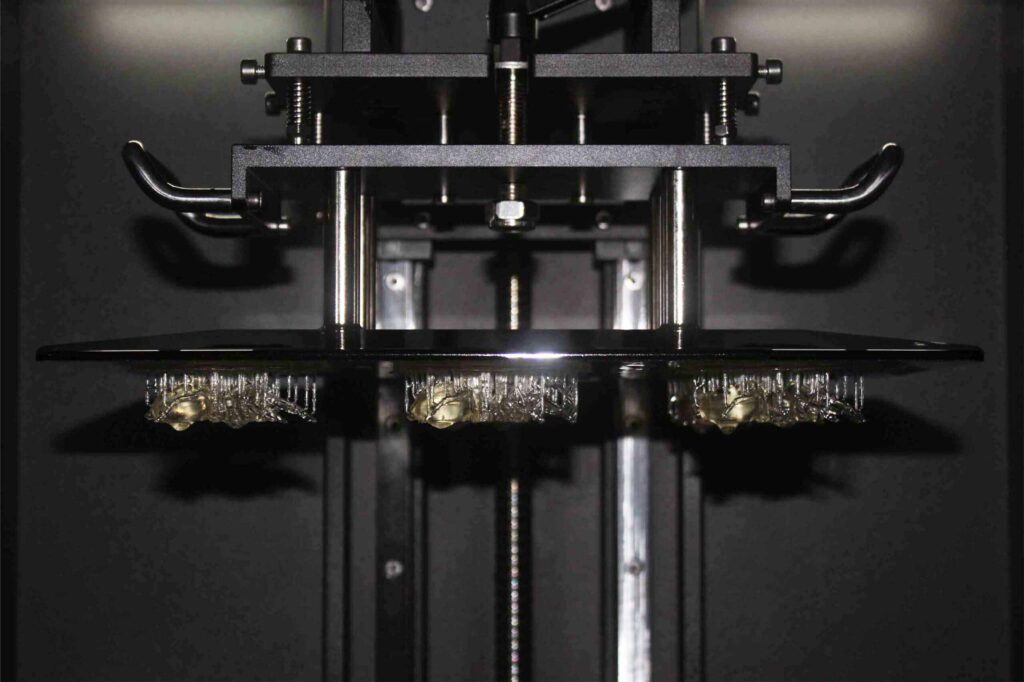
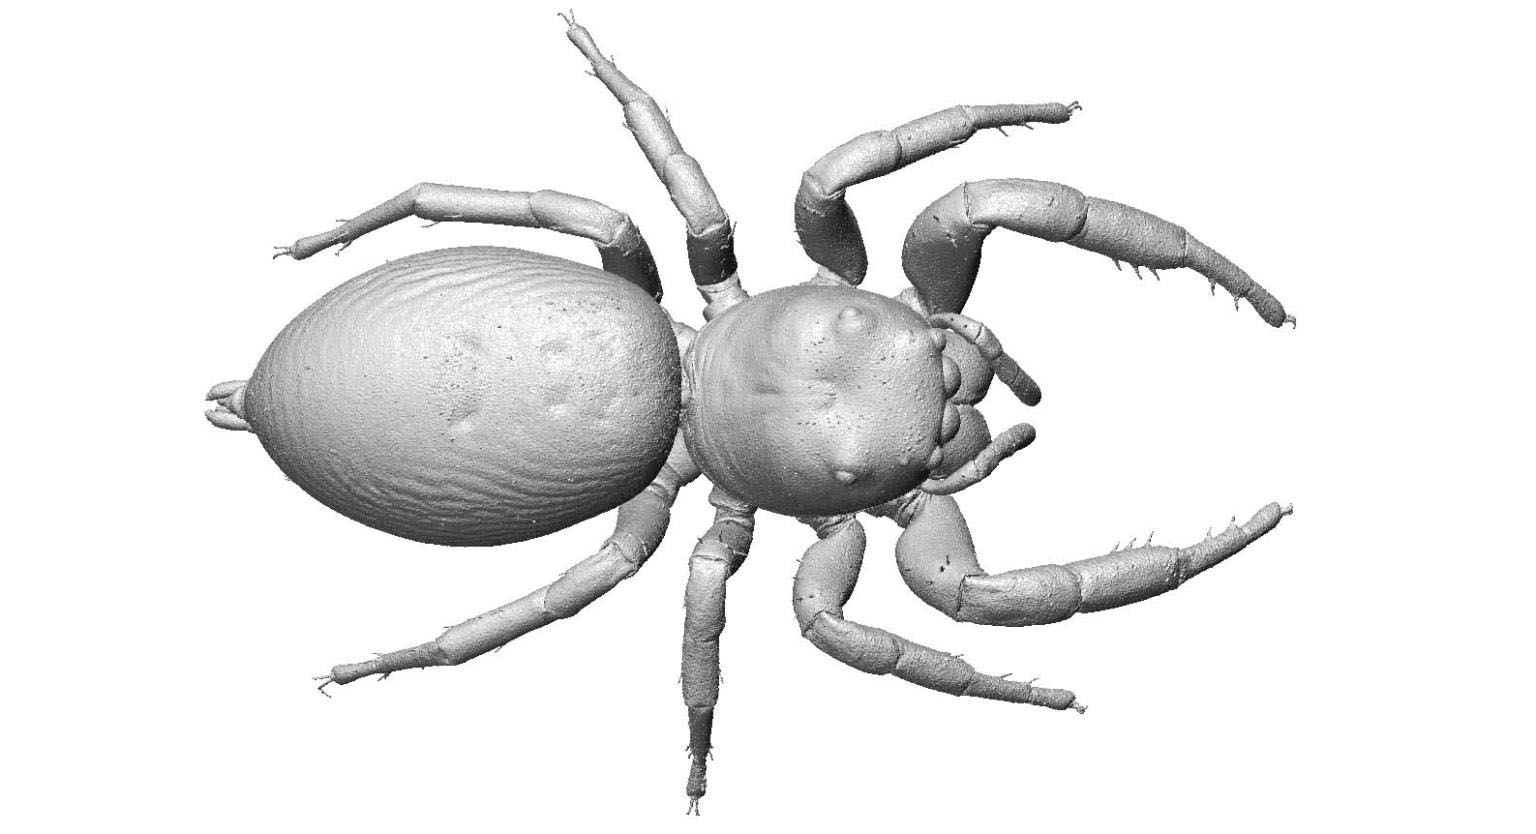
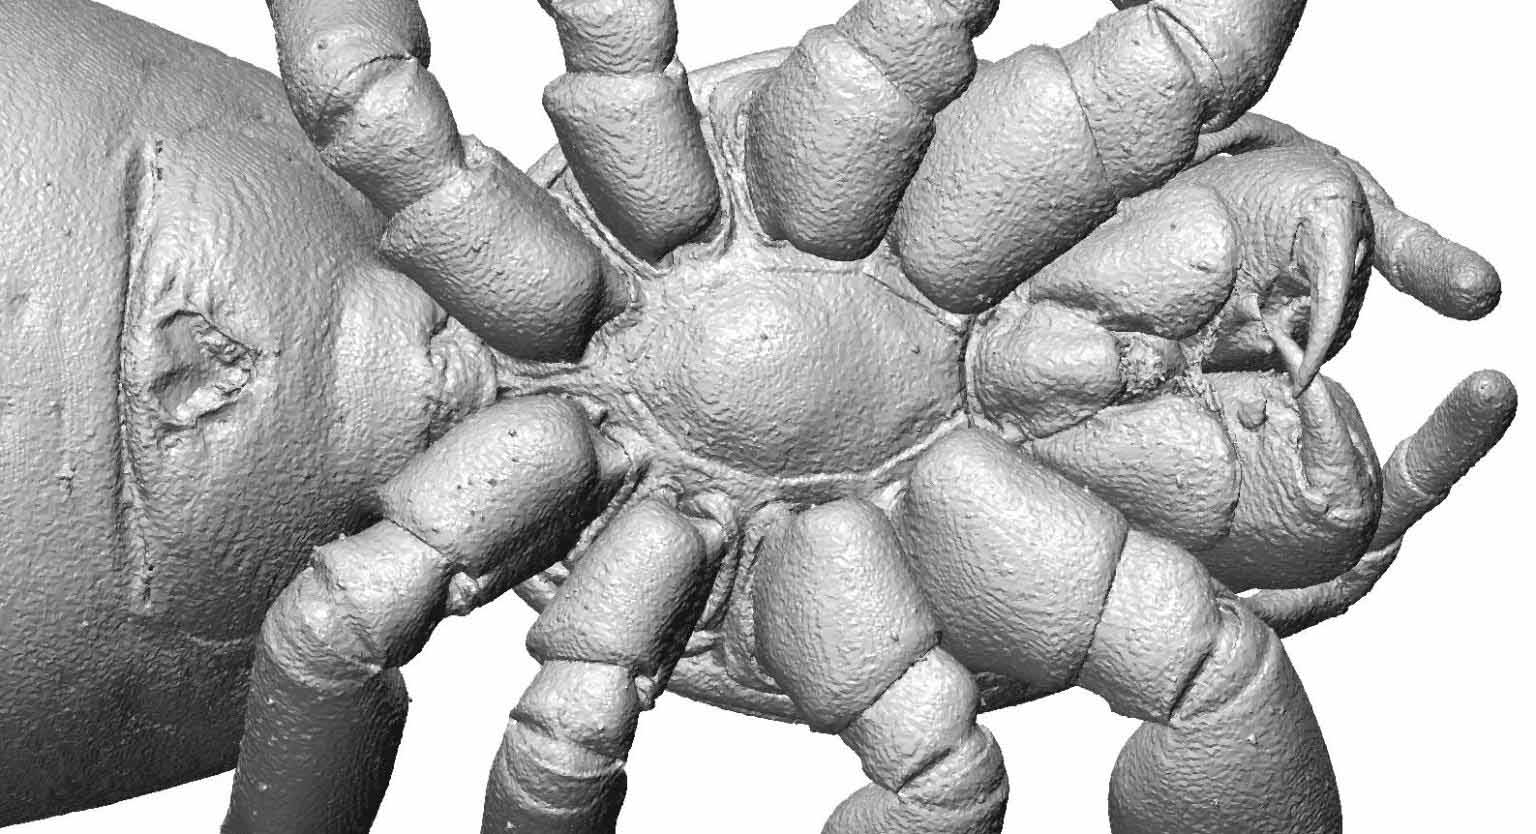
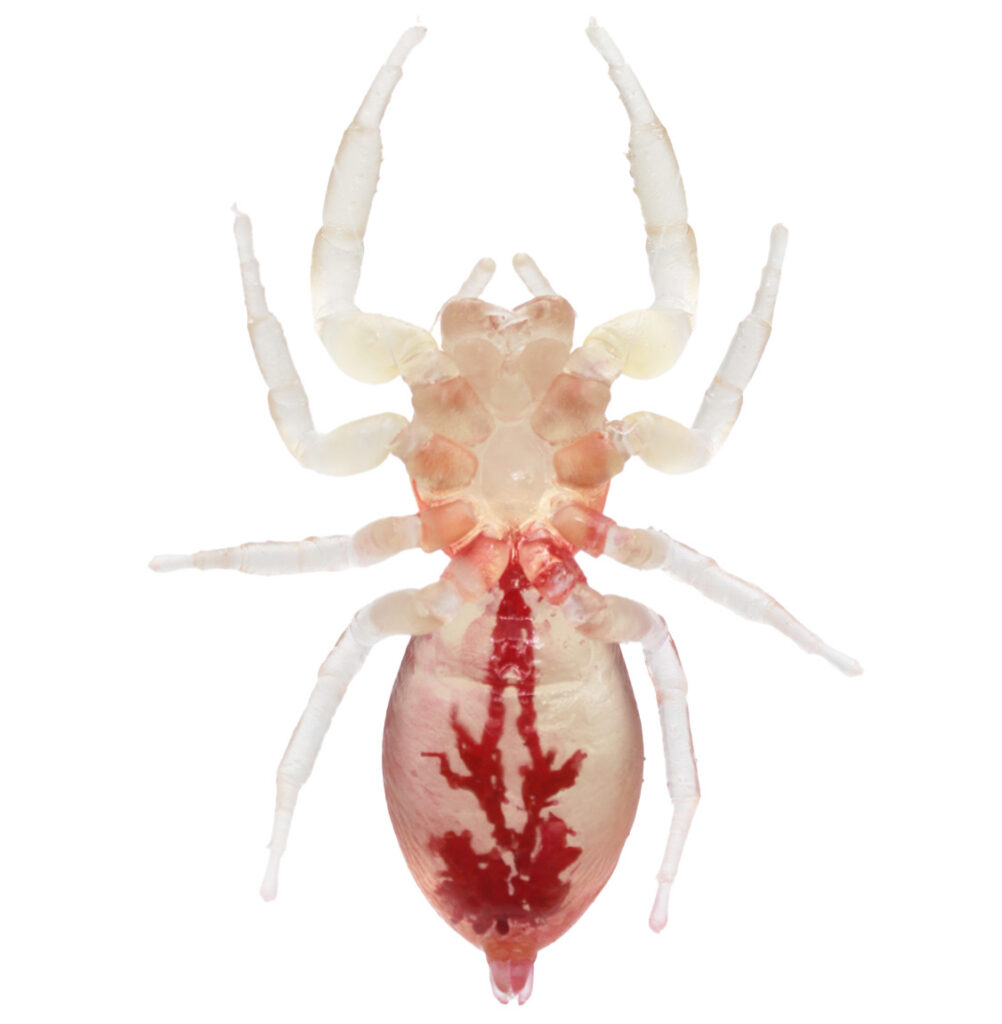
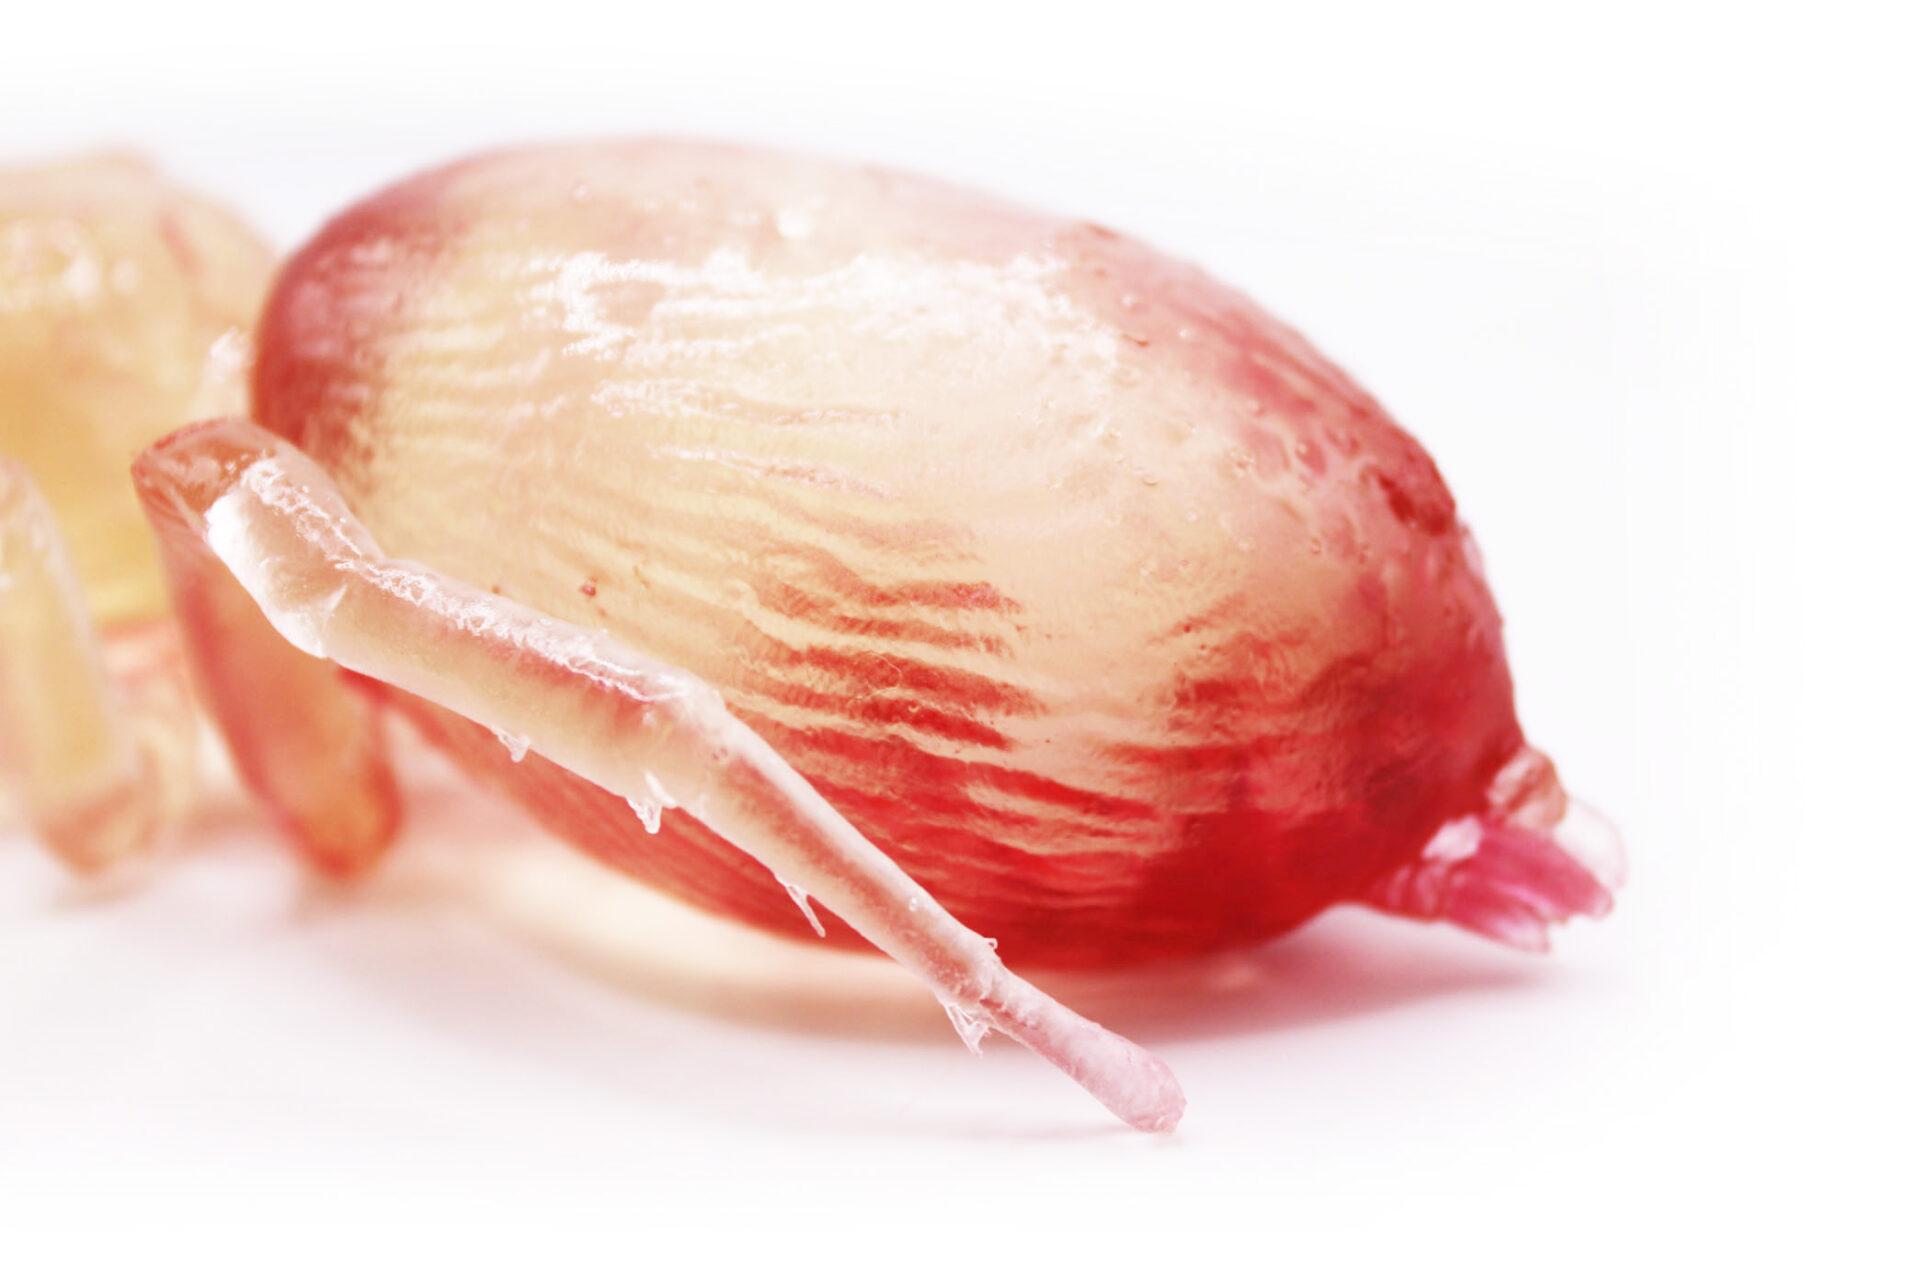
With our micro-focus CT scanning systems we are able to collect the incredible details of objects like this spider. Learn more about the capability on our CT Scanning Services page.
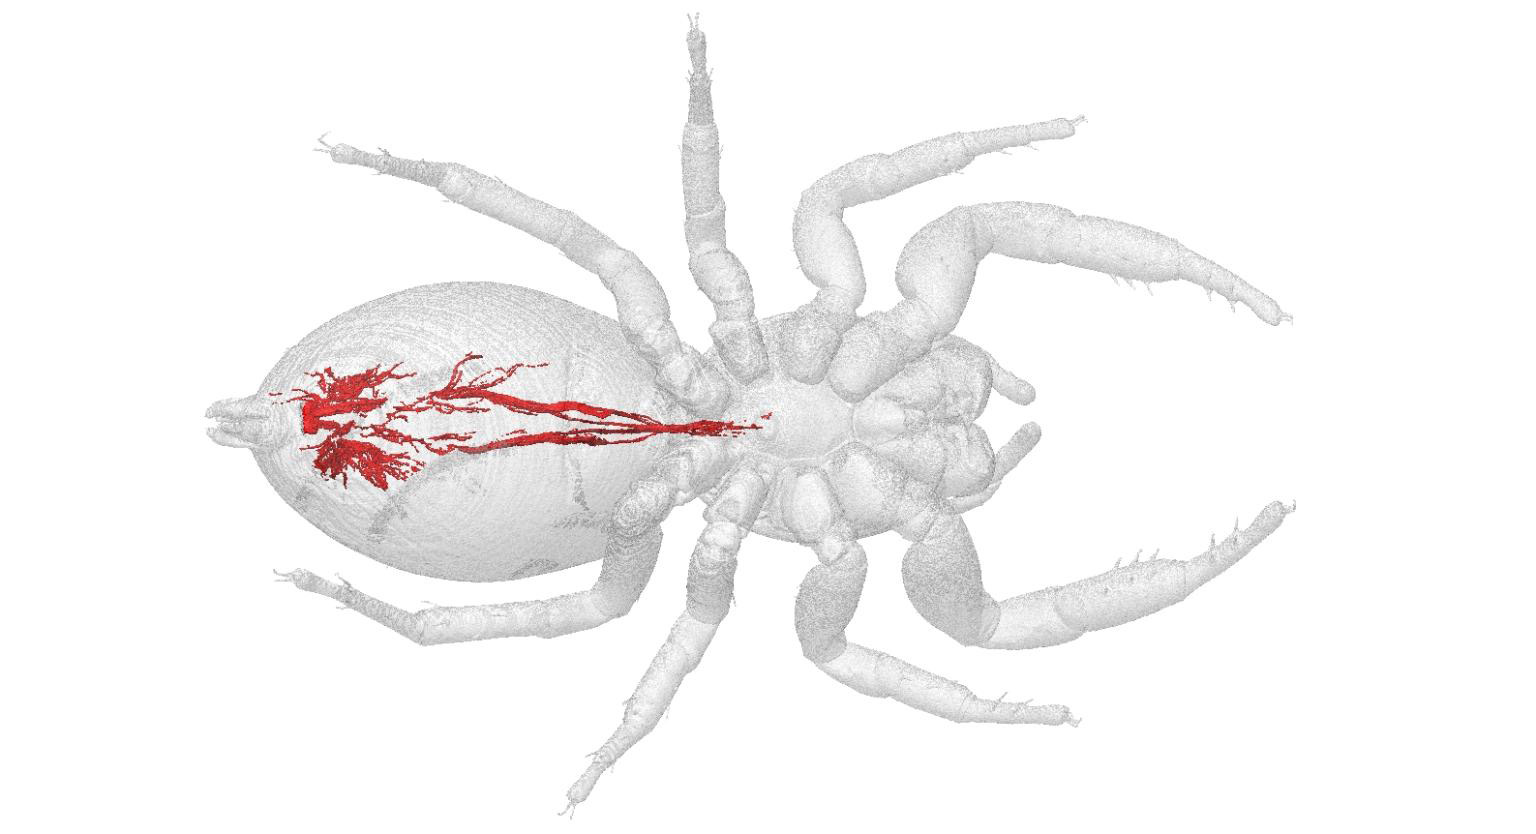
The final result of the scan is a high resolution, water tight STL which is perfect for 3D printing. What isn’t perfect for printing is the internal geometry – the spinnerets. To really do something exceptional we printed the spider clear in order to make the inside geometry visible.
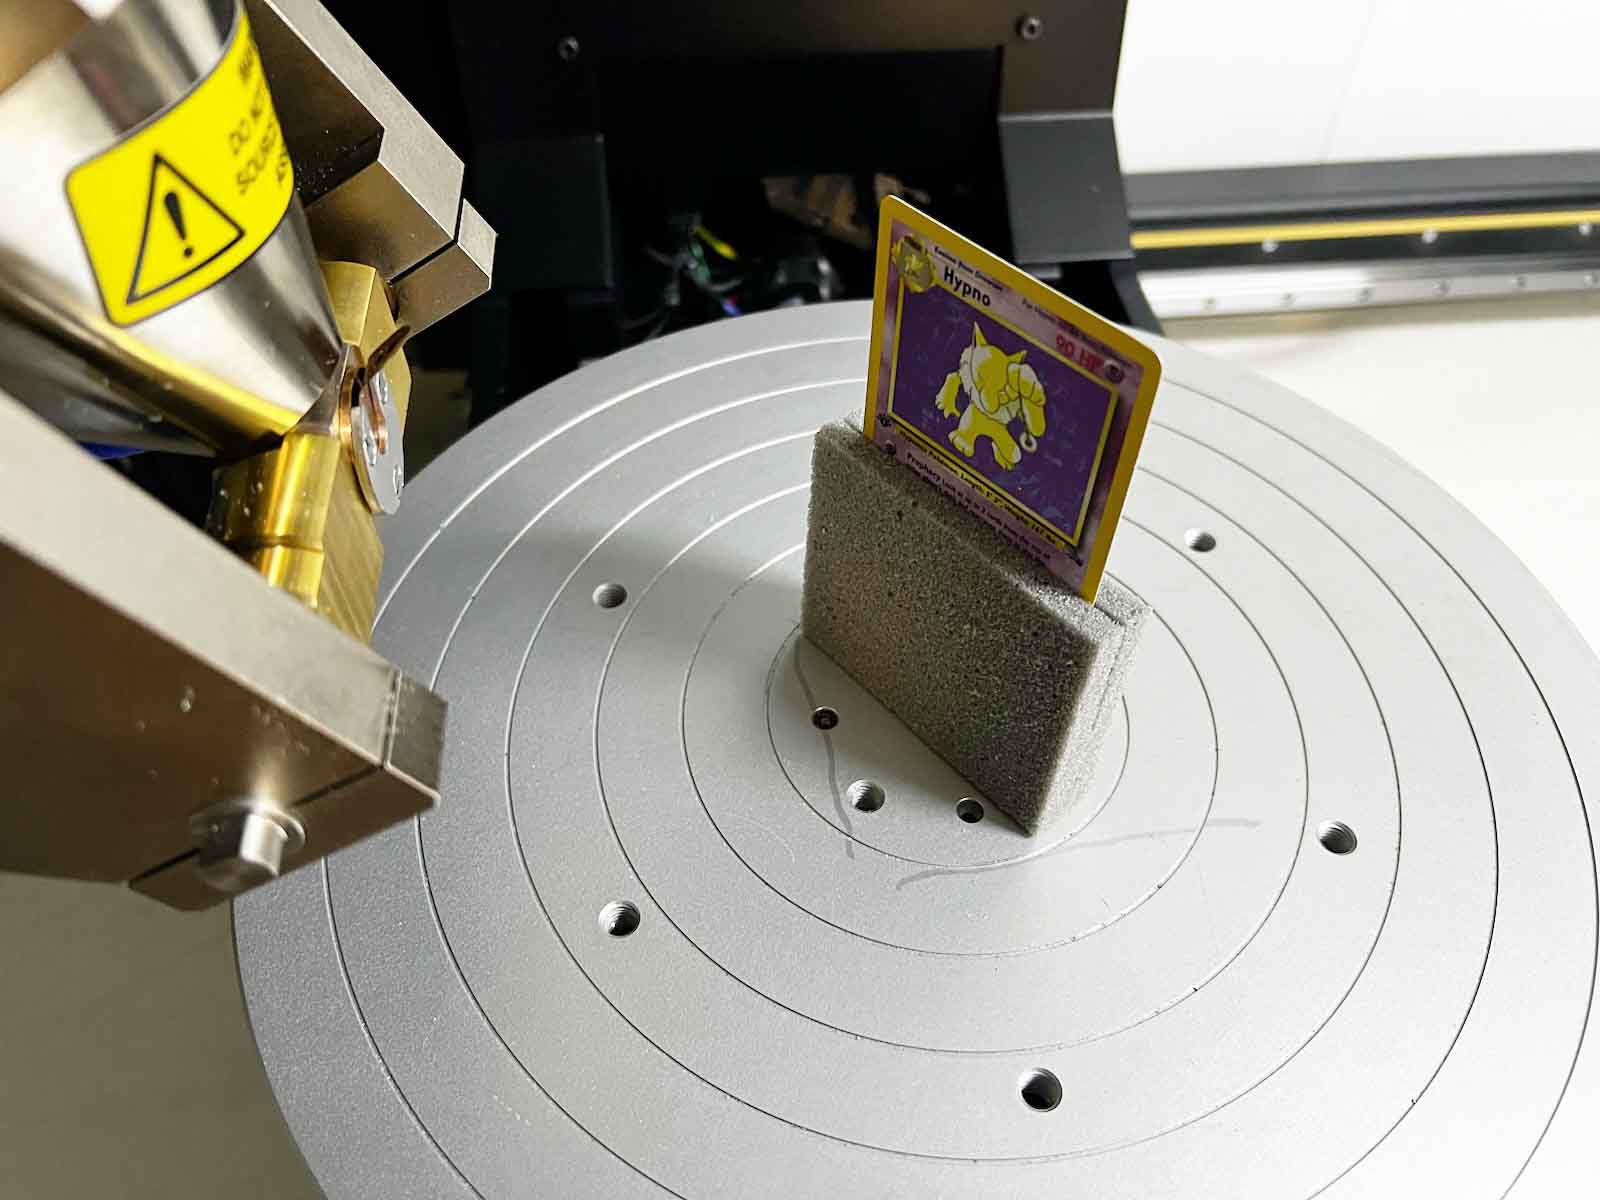
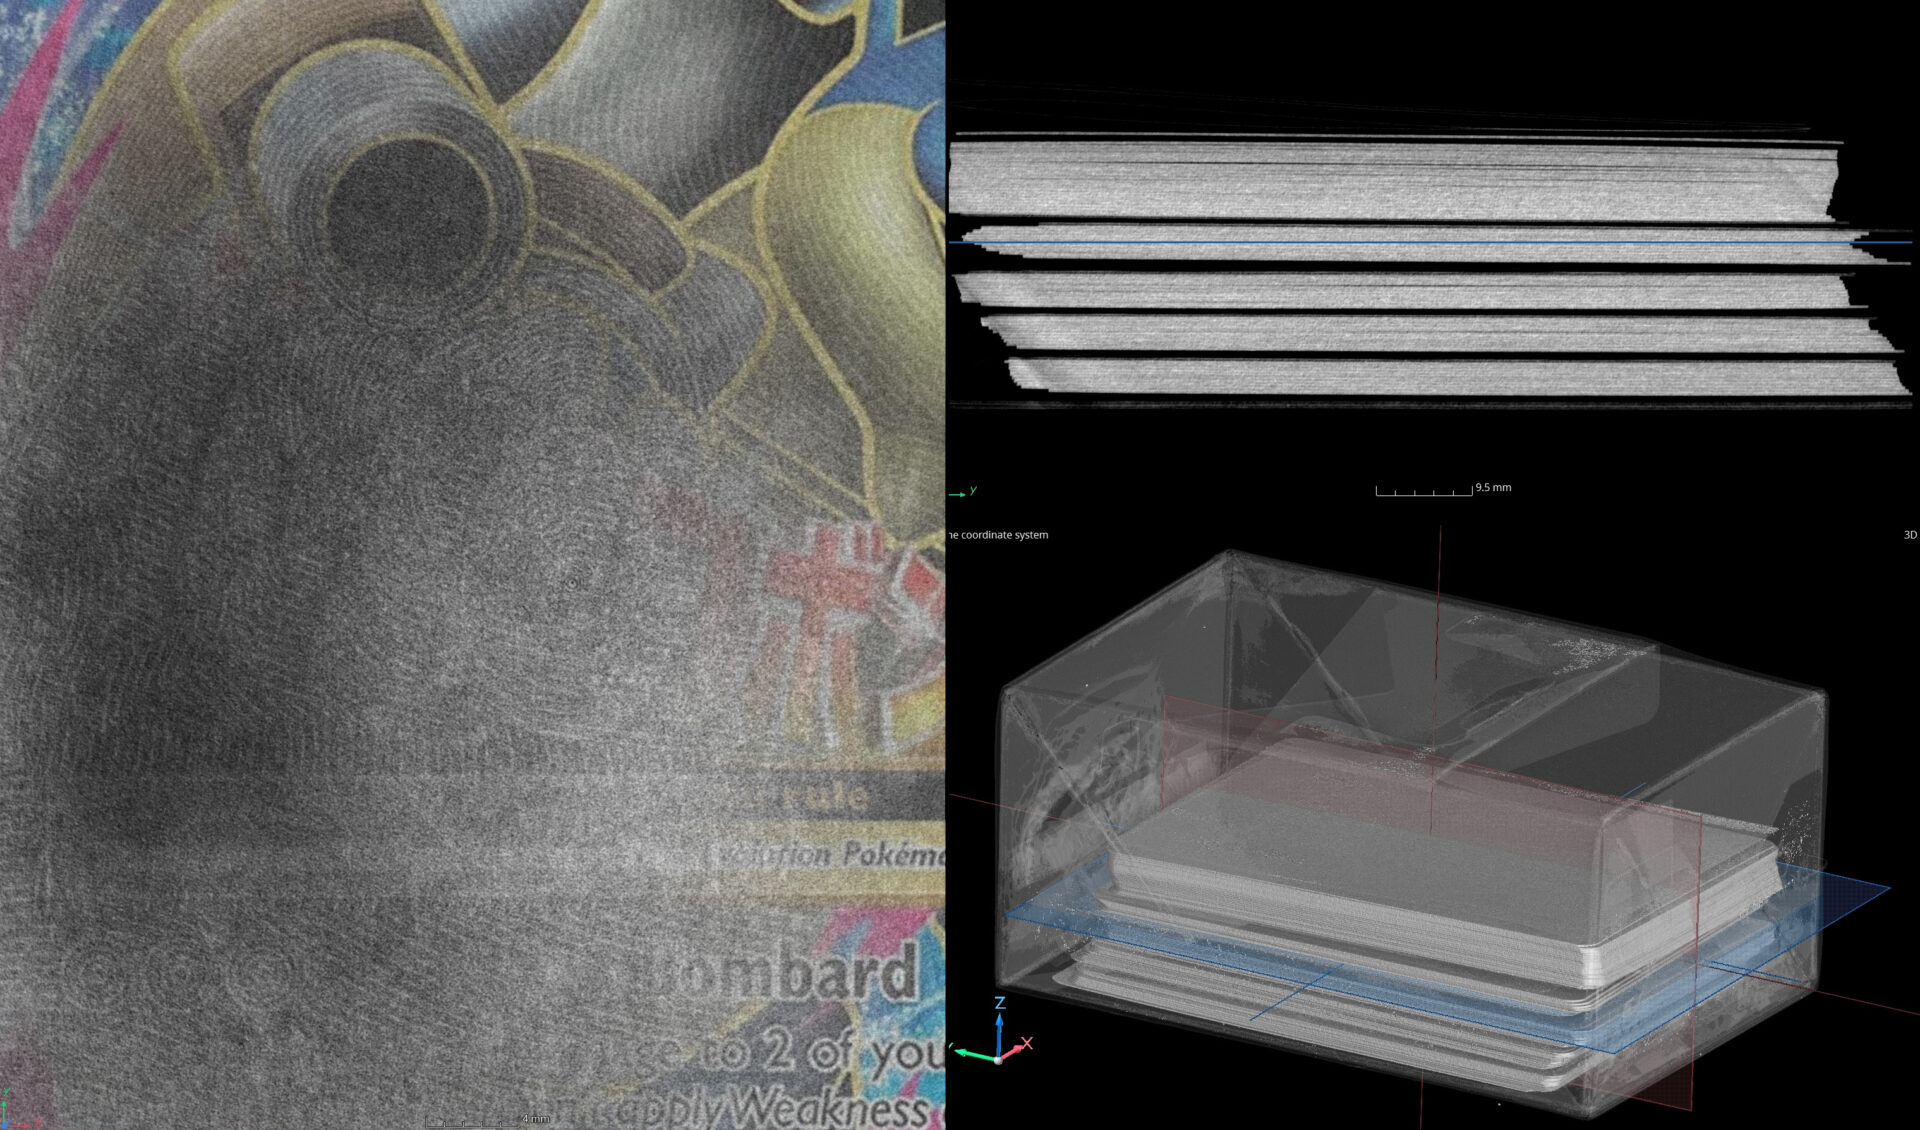
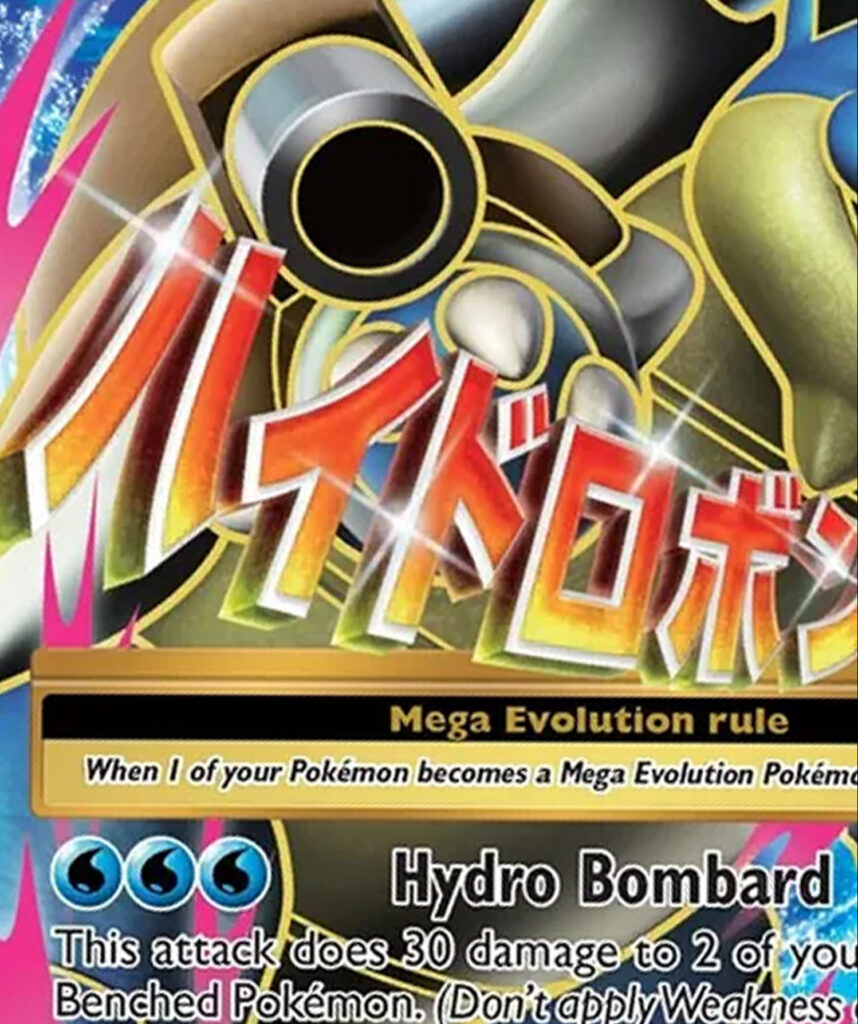
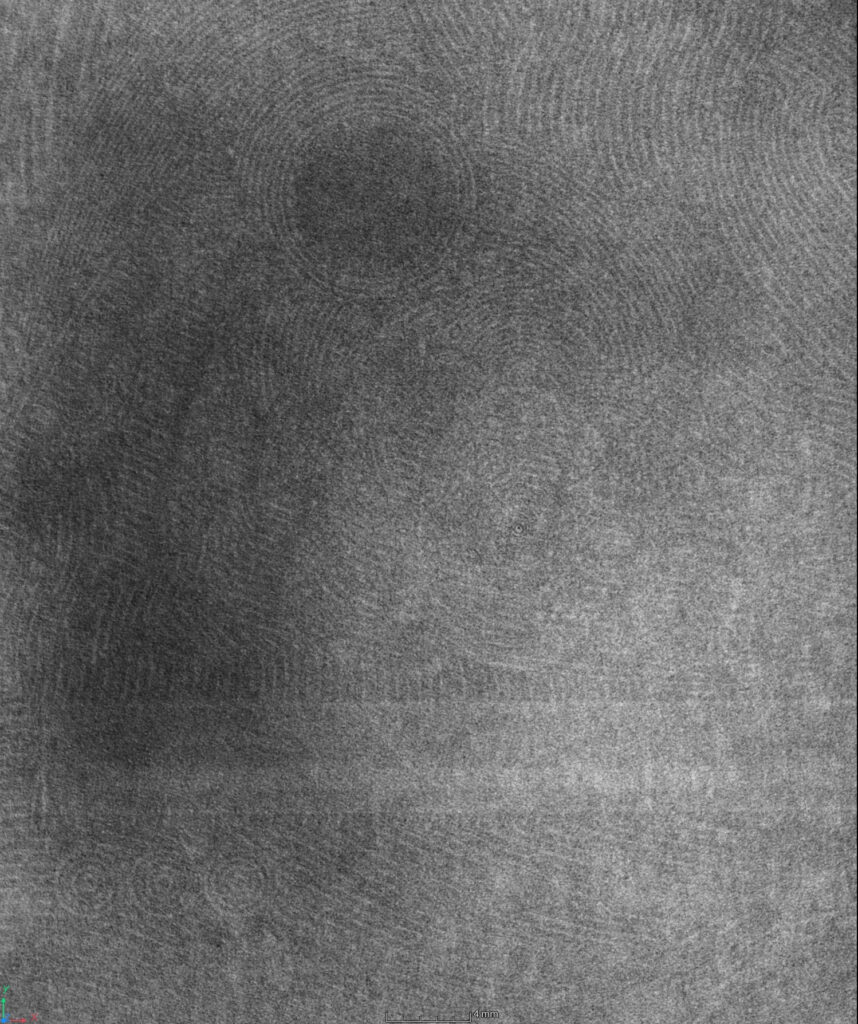
This case study is a testament to the sensitivity of Industrial CT imaging. Our team has been able to characterize holographic cards in unopened Pokémon packs. The concept formed during brainstorming sessions for application case studies. After spending endless hours researching packs and cards, spending thousands of dollars on them, and many late nights testing and optimizing parameters, we were able to extract the shape of the Pokémon due to slight density differences in the cards and foils.
Below is our initial test card – a 1st Edition Fossil Hypno (Cert #3902070061) that we broke out of the case to test by sleeving it between several other cards to represent a pack. The GIF shows a transition between an aligned image of the card and the CT slice plane.
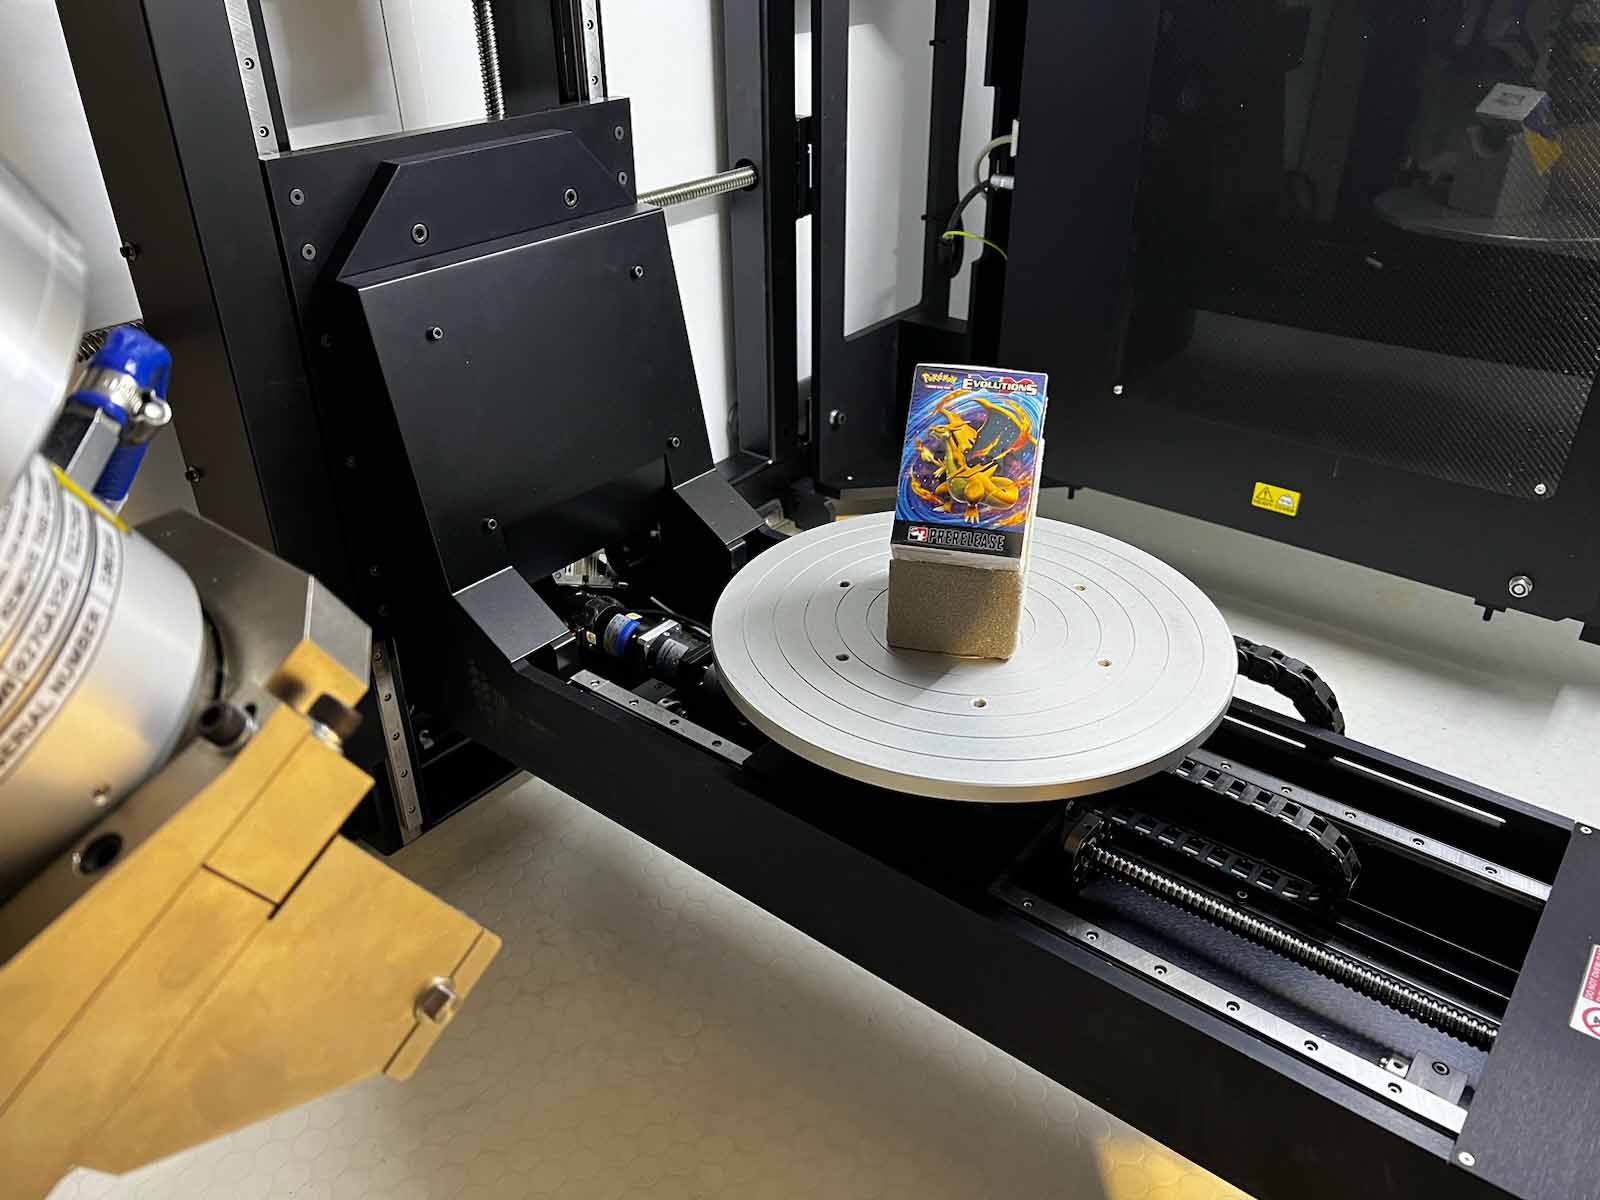
Because of the incredible results we felt more comfortable buying a couple fossil packs, and with the success of the packs we moved on to entire kits.
Below is an M Blastoise EX from an XY – Evolutions kit worth $700. The bottom left view shows the exact location of the card. While there are several other holographics in the packs contained in this kit, we’ll keep what they are a secret for now.
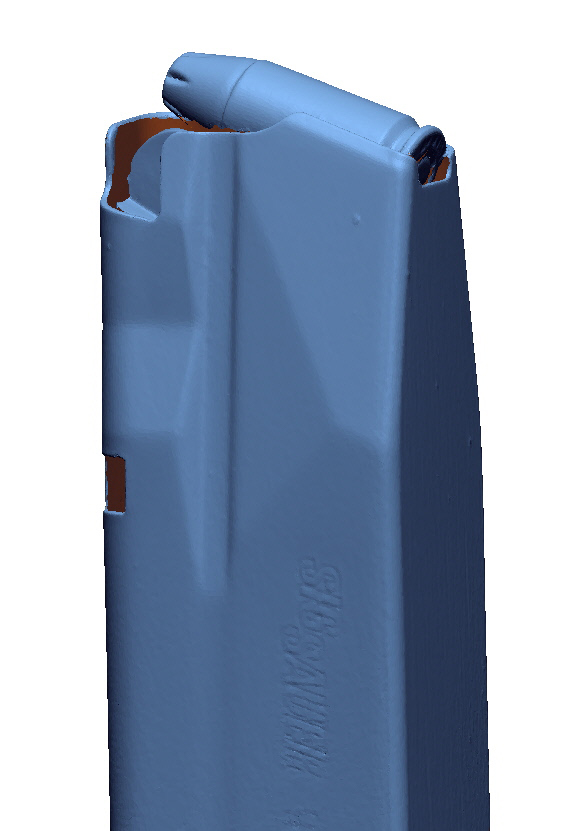
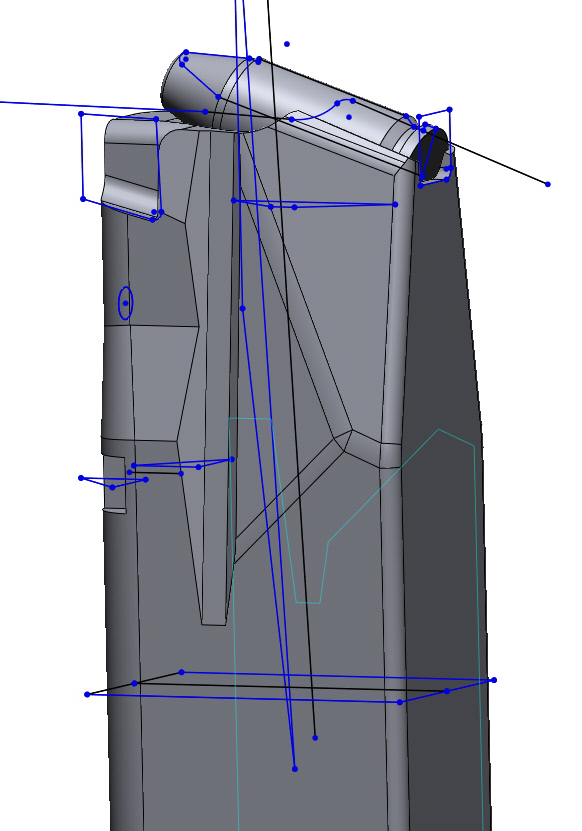
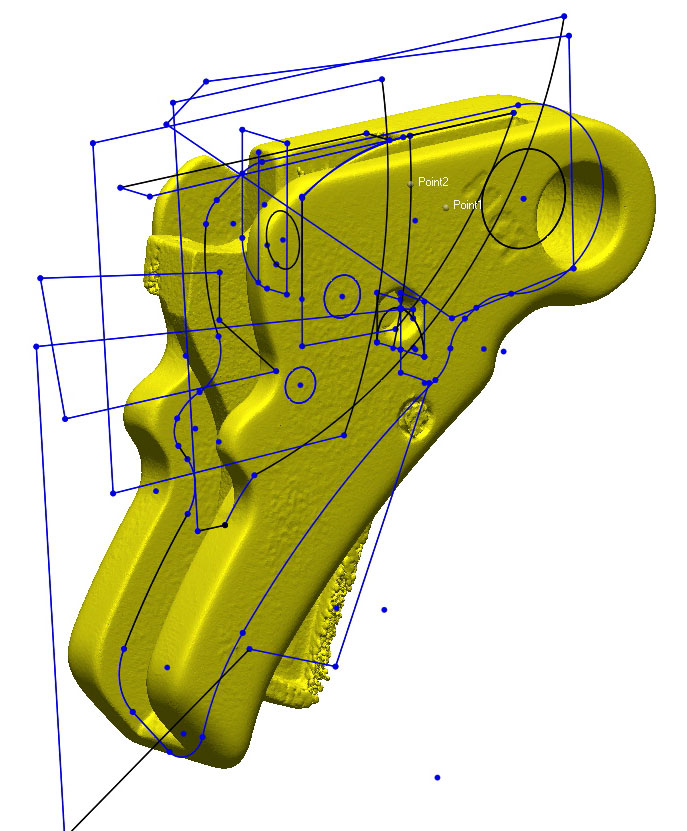
High resolution scan data acquired by our laser and CT systems is used to reverse engineer firearm components. This data can be used to modify existing hardware or build new components around historical or existing hardware.
Below is a magazine that was scanned with a 9mm round. The steps include:
Laser scan the components
Model the components in Geomagic relative to the laser scan
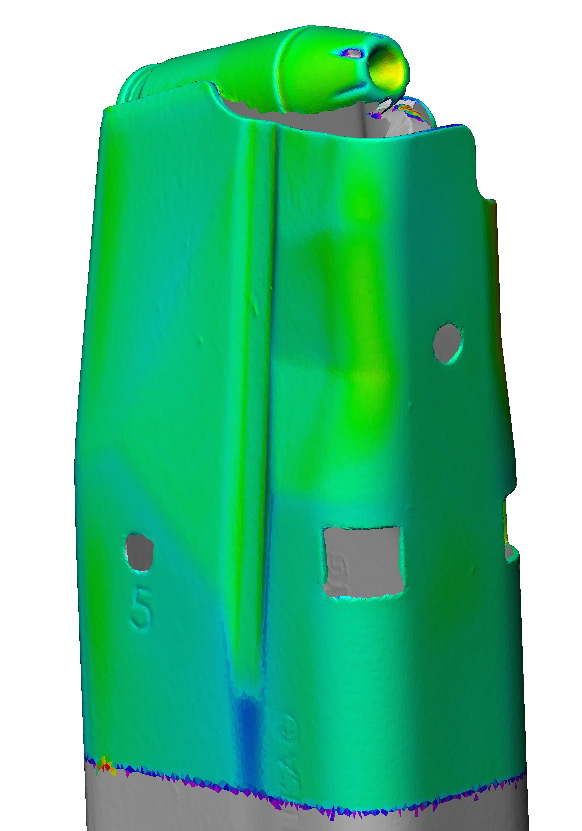
Compare the produced model back to the scan file to ensure accuracy
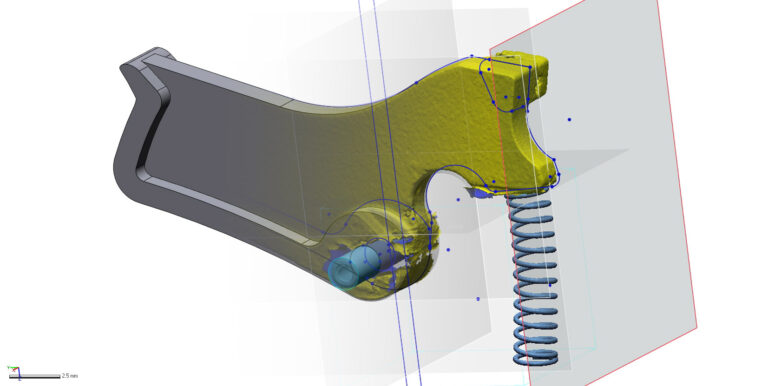
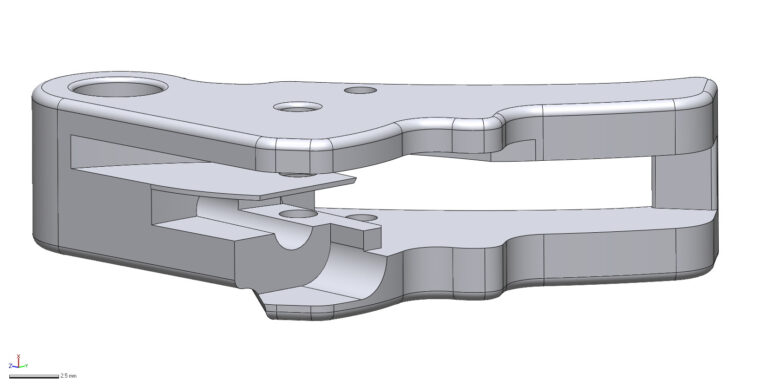
CT SCANNING INTRICATE COMPONENTS
Many gun components are small and intricate. Some scanning devices may not have the resolution or ability to capture all the necessary geometry for an accurate model. CT scanning allows us to acquire surfaces like slots and assemblies without completely disassembling them. While mixed-material assemblies can be problematic (steel against plastic), there is typically a way to stage the part to get useful data.
This trigger assembly is plastic with metal springs and pins.
Laser & CT scanning produces high accuracy, water tight digital representations of products to be used for part to part and part to CAD dimensional inspection.
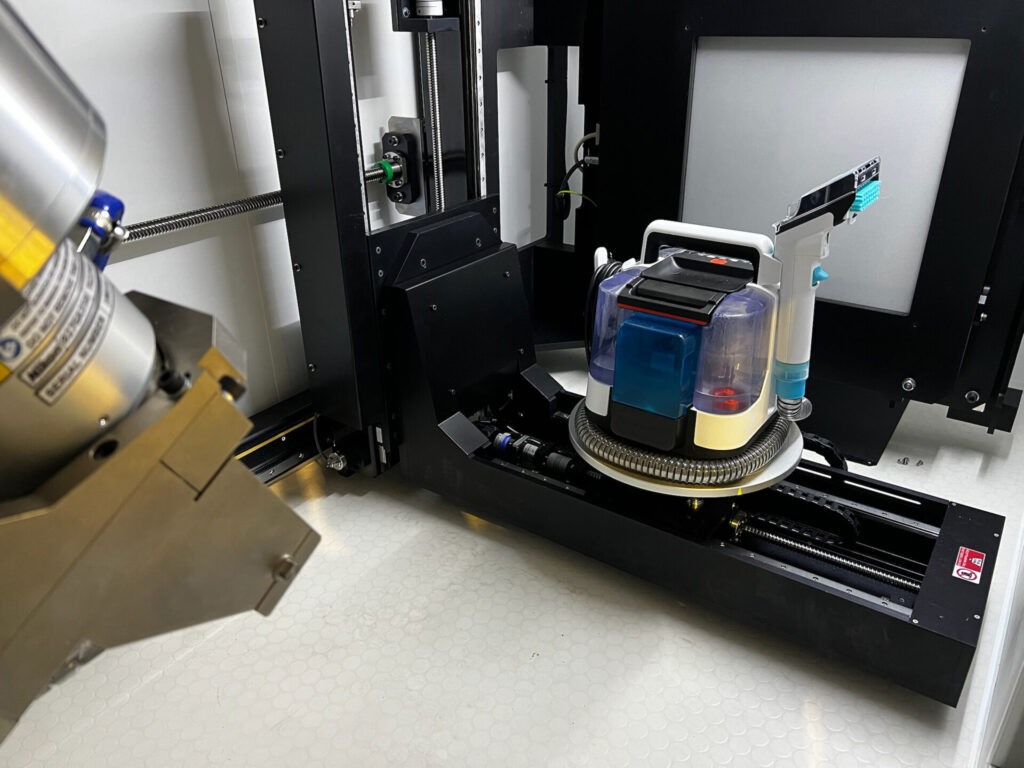
This case study demonstrates the measurement of slop between two wet vacuum attachments. One attachment was noticeably looser than the other but defining exactly where would not be possible without mapping the entire mating point.
Data was acquired in our Nikon Industrial CT Scanner, exported to .STL, and imported into PolyWorks Metrology Suite for dimensional comparison.
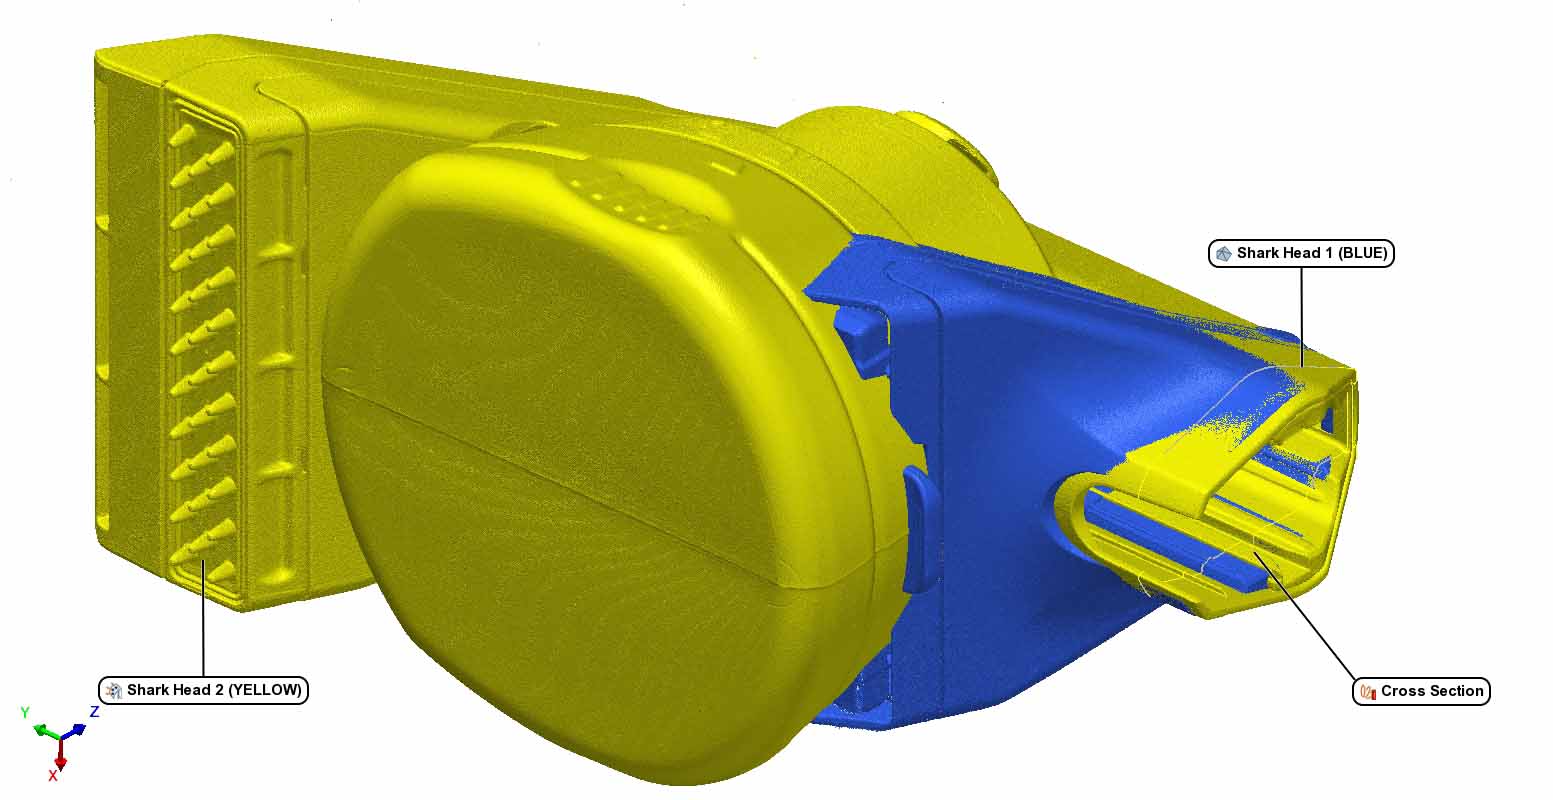
HEAD 2 ALIGNED TO HEAD 1
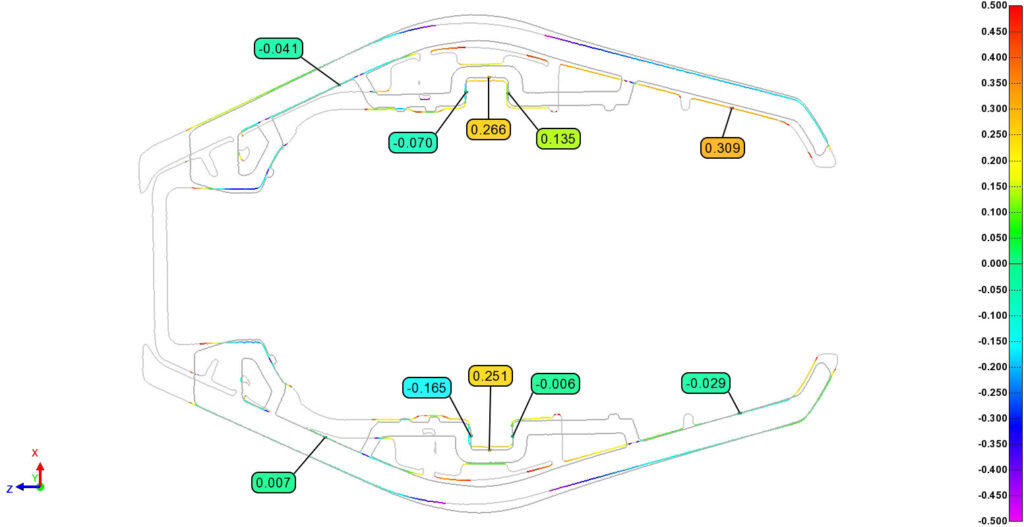
A local best fit of the mating zones was created and a cross section was placed at the area of interest: the plunger and rib track which aligns the head to the hose.
HEAD 2 ALIGNED TO HEAD 1
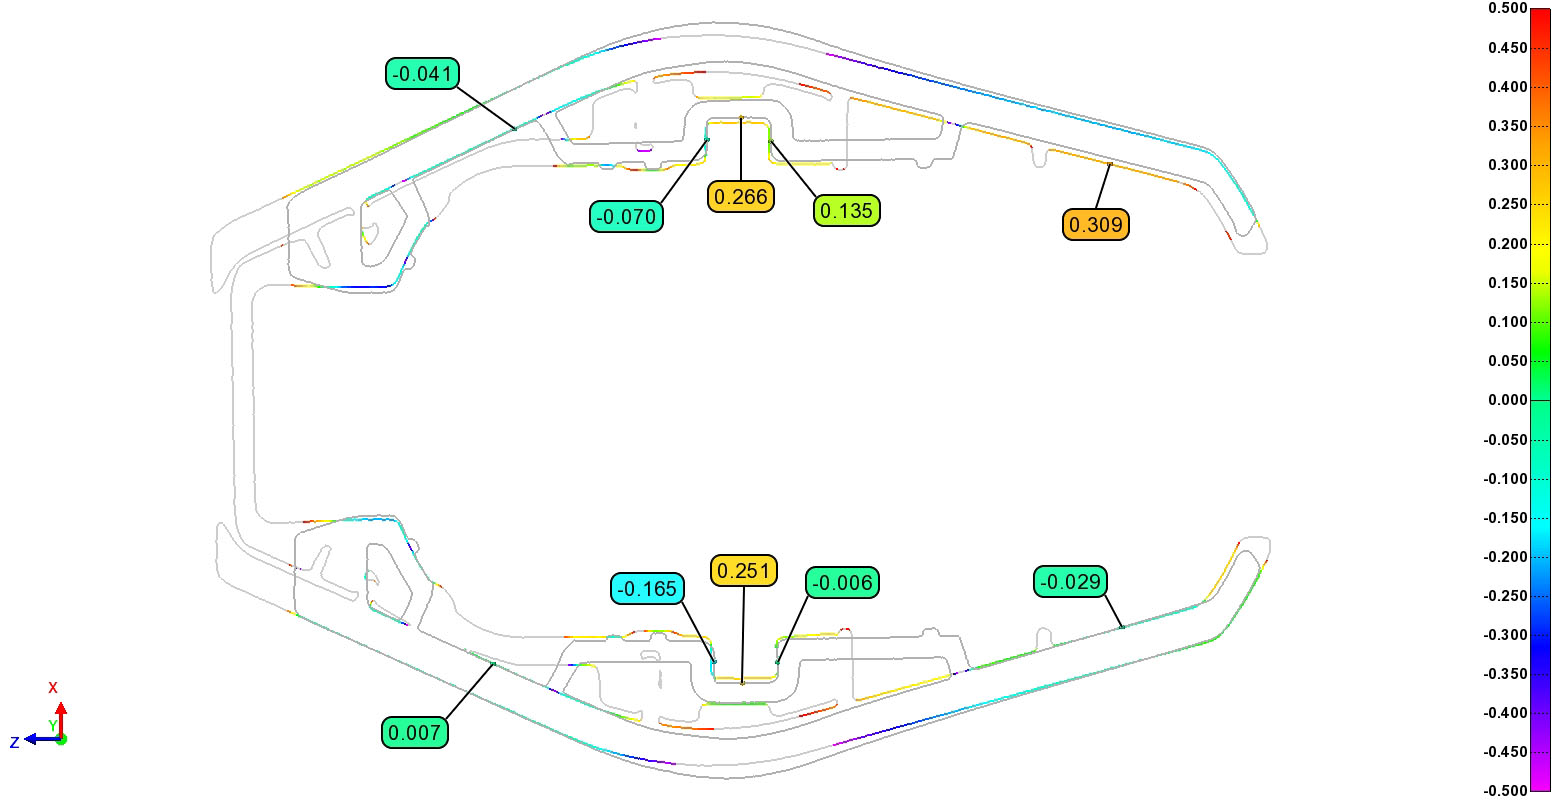
The 2D cross section provides a color-coded profile of a line heatmap. Green to Red colors indicate the “compared” geometry is positive (proud) compared to the reference geometry, while Green to Purple colors indicated geometry is negative (shy) compared to the reference geometry. This tells us the loose fitting head has a larger profile than the tight head and can help engineers tune their molding process.
In just a few steps you can become an expert CT analyst. This guide demonstrates the basic, step-by-step functions of the industrial CT industry’s standard software: Volume Graphic’s myVGL Viewer.
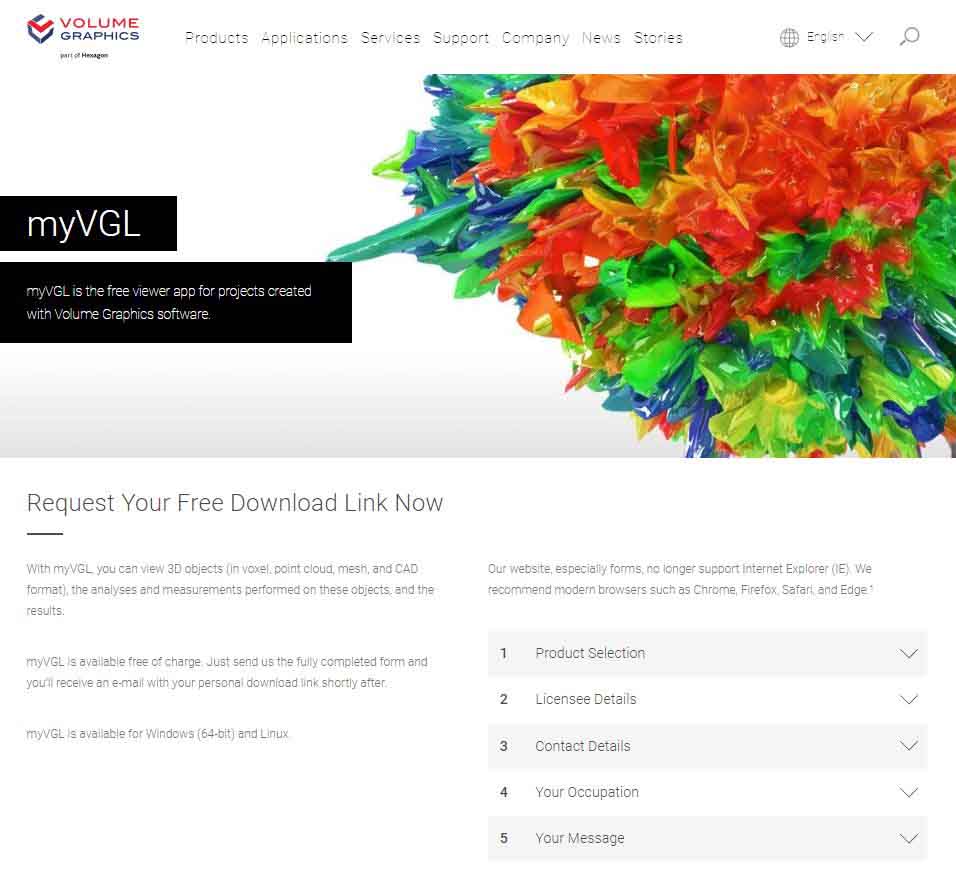
1.Download myVGL & Open File
myVGL is the free viewing app for projects created with Volume Graphics Software.
With myVGL, you can view 3D objects (in voxel, point cloud, mesh, and CAD format), the analyses and measurements performed on these objects, and define your own measurements and imaging results!
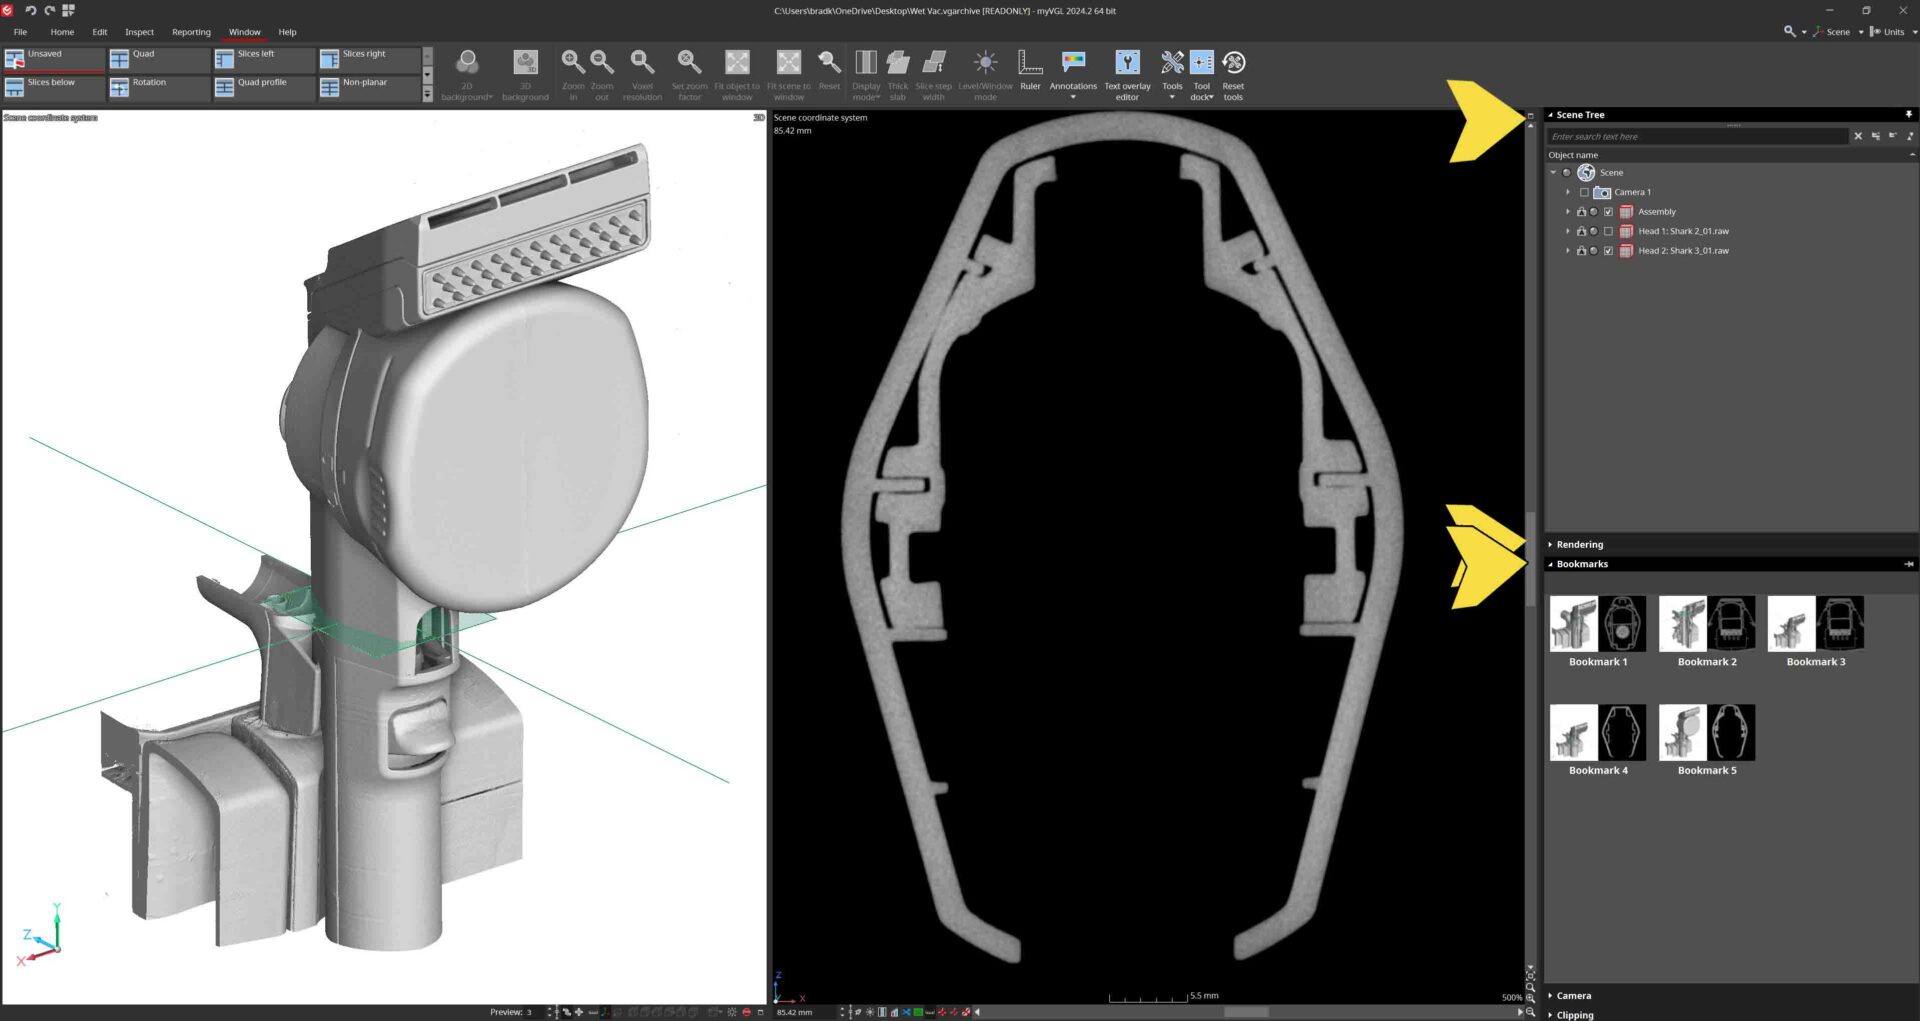
2.ACTIVATE NECESSARY TOOLS
Navigate to the Window pane. To the right, click the “Tools” drop down to activate important sidebar options like Rendering, Scene Tree, and Bookmarks.
Rendering allows for contrast adjustment, Scene Tree shows the different files and tools within the project, and Bookmarks allow you to navigate between saved images.
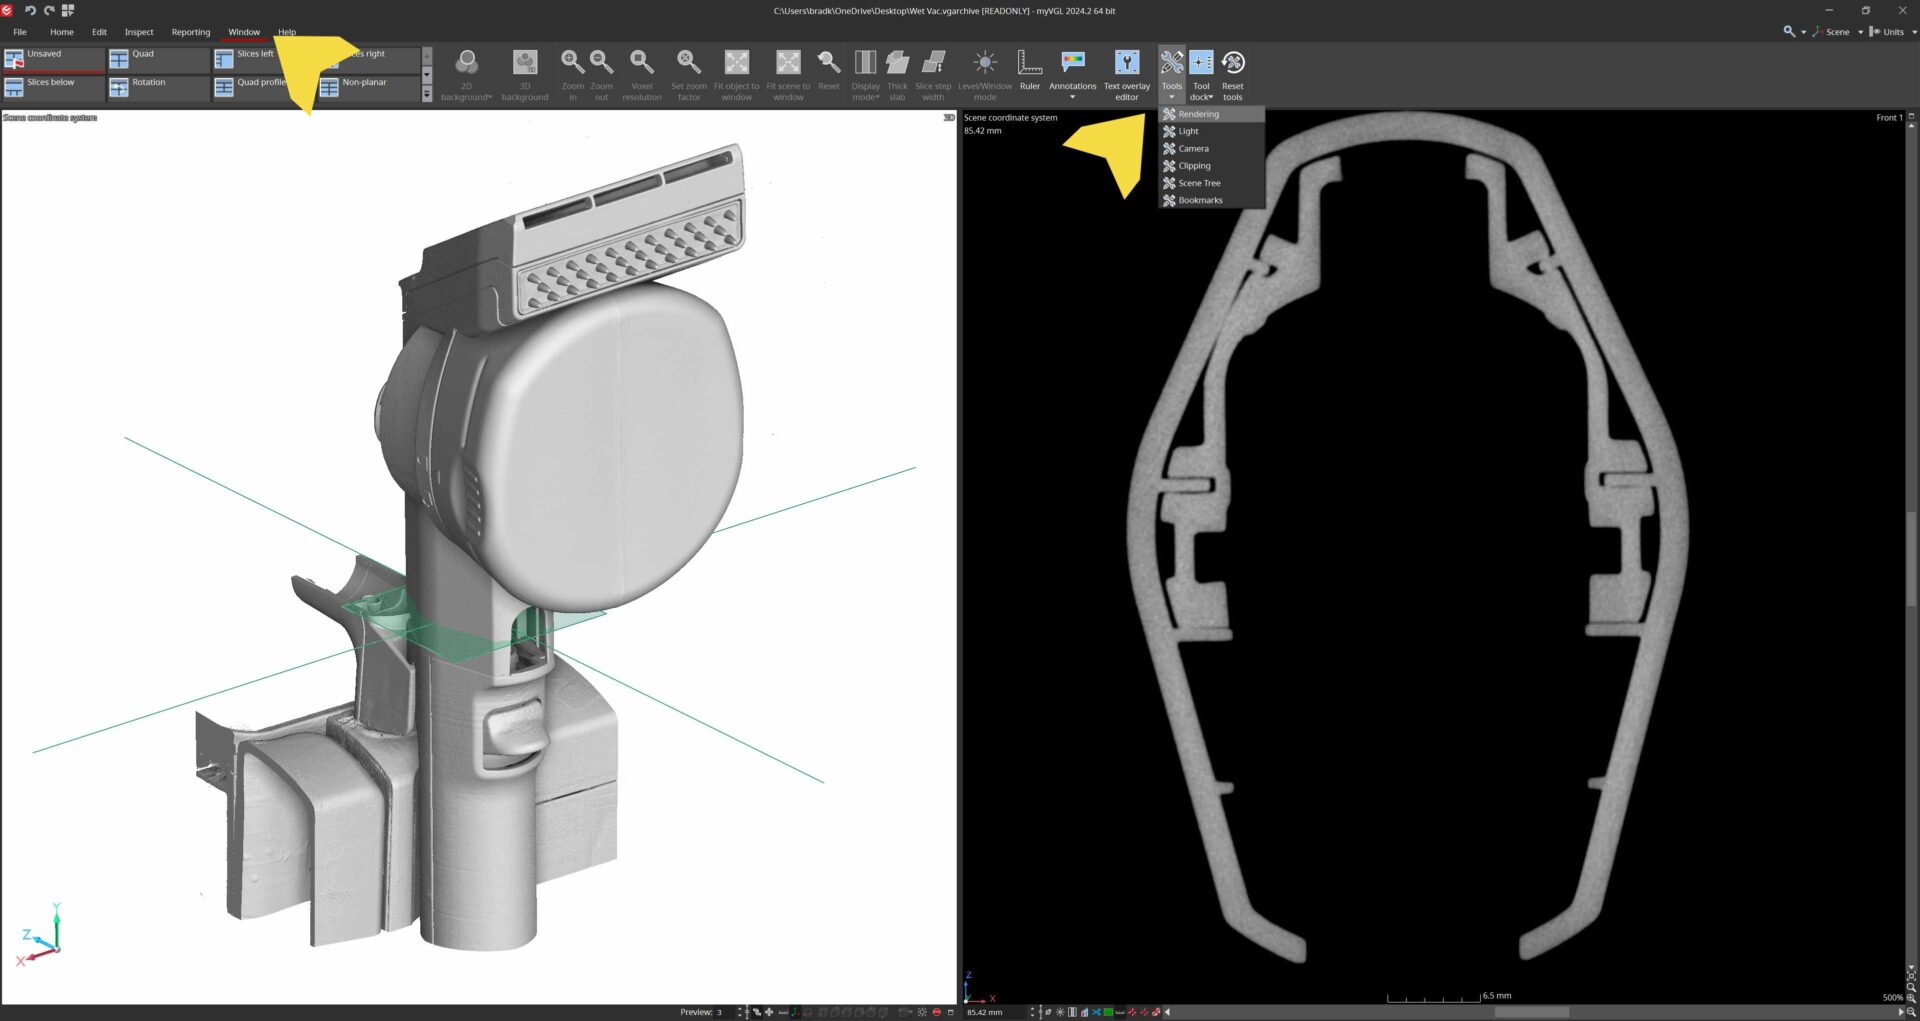
3.NAVIGATION
Clicking the cursor navigation button in the upper left corner allows the user to navigate to a single location in all window views simultaneously. Hold Ctrl + Left Click any location.
In the Window menu the viewing panes can be modified or removed for optimal viewing of areas of interest. Quad View is standard which shows all three planar directions and a 3D render view in the bottom right. Additional options include Rotational View about an axis, or Unroll View which planarizes cylindrical features.
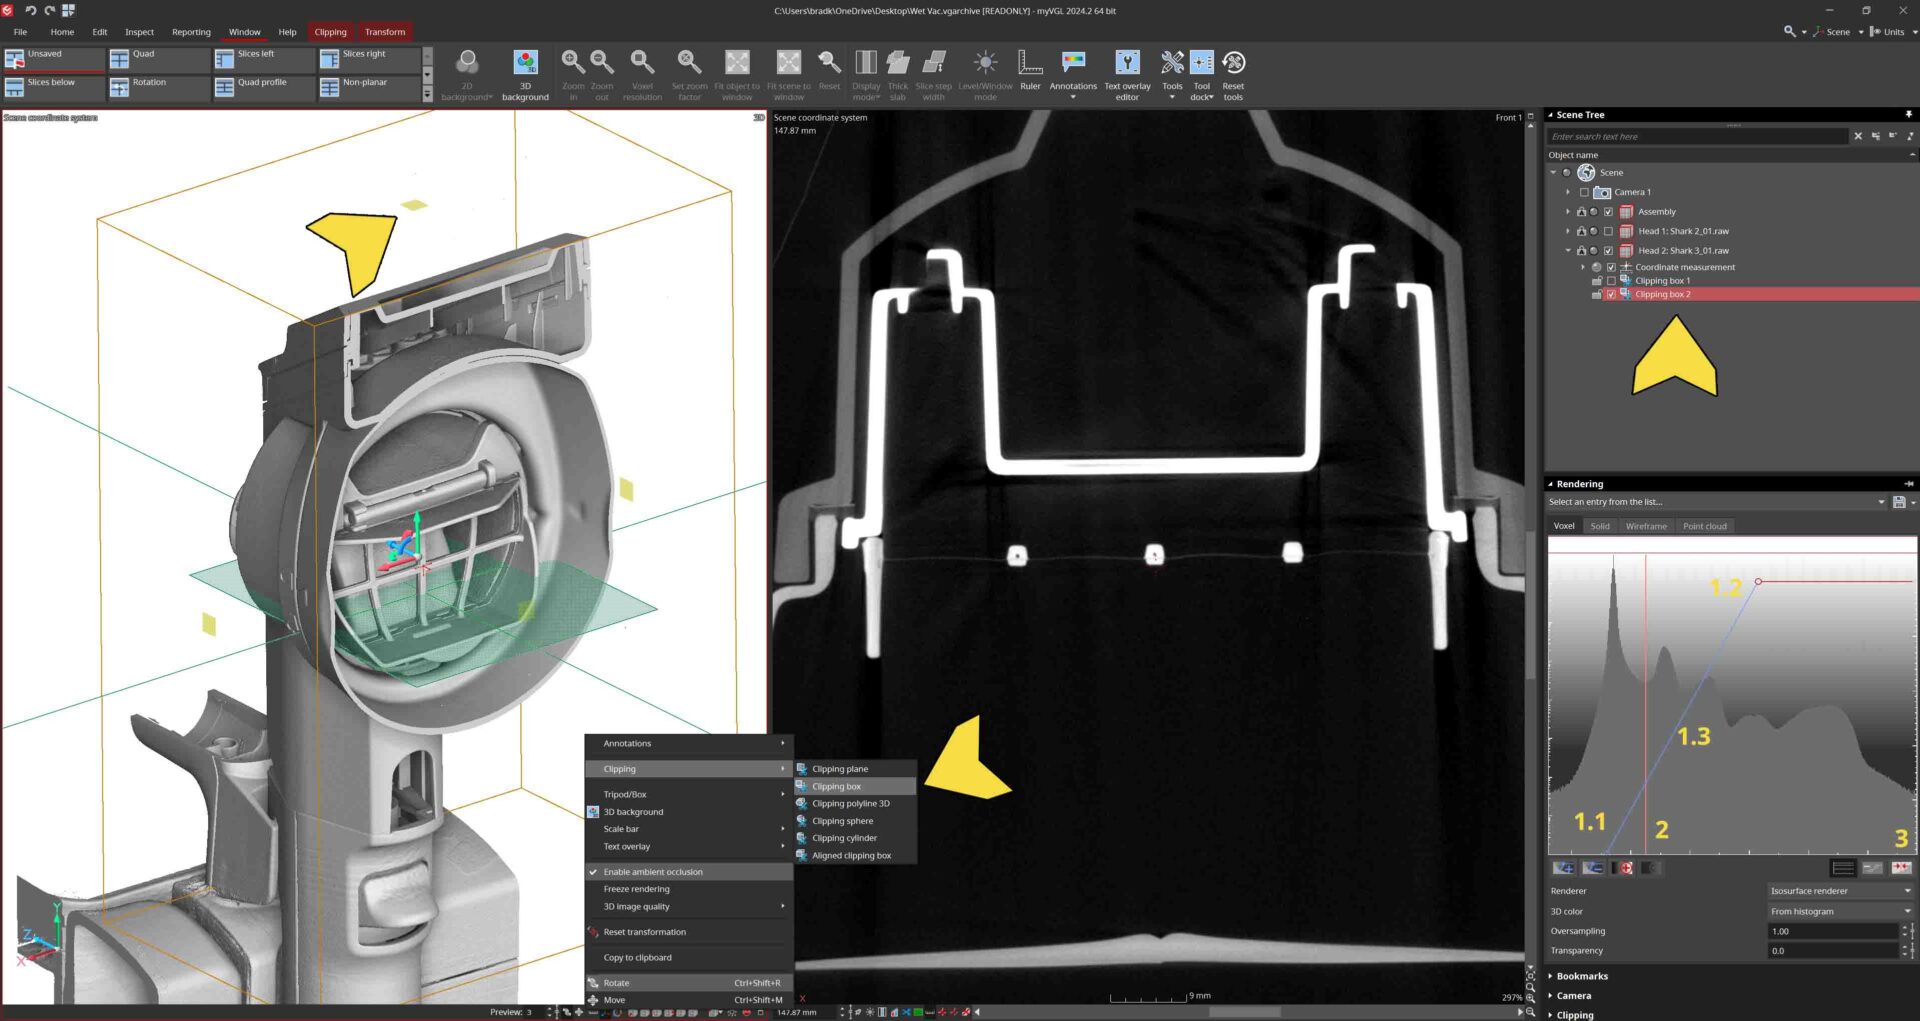
4.CONTRAST & RENDER ADJUSTMENT
Adjusting the contrast of the scan data is done in the Rendering window you activate earlier. The Histogram contains a variety of tools including a sliding bar. At the ends of the bar are upper and lower limit handles (1.1 and 1.2). Drag these to adjust the contrast. You can move both handles simultaneously by selecting and dragging 1.3. Location 2 shows the Gray Value rendering slider and Location 3 activites and deactivates the ability to adjust the Gray Value rendering slider.
Right clicking the 3D renderopens a menu with a variety of options including clipping tools. Clipping tools can be used to digitally section the part, and the sections are saved to be activated or deactivated in the upper right Scene Tree.
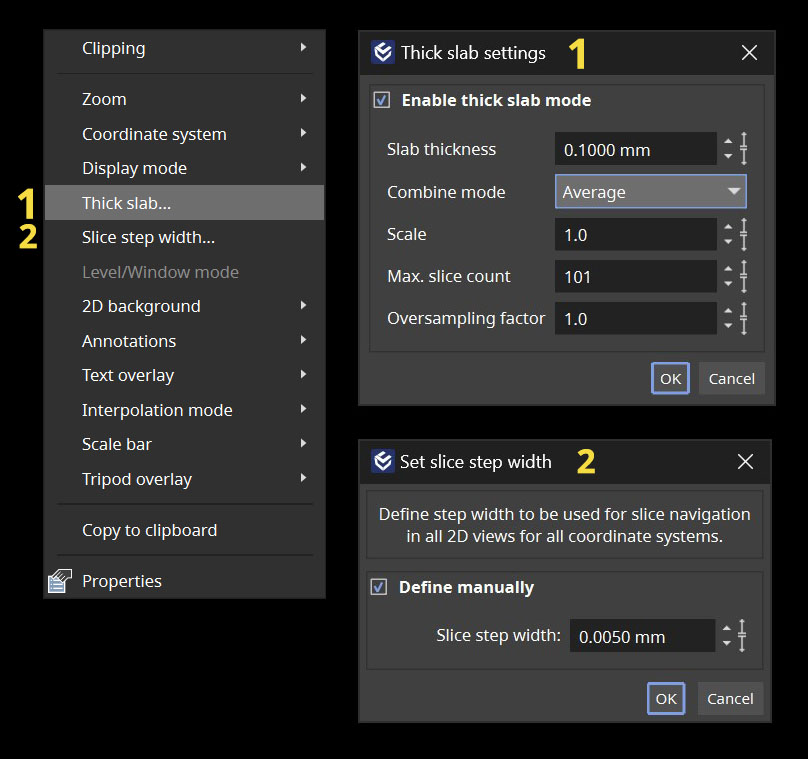
5.SLICE SETTINGS
Right click any viewing pane to open pane settings menu. Primary viewing tools including:
Thick slab – the slice thickness control which has parameters to define thickness, bring forward the highest density gray values in that thickness, slice averaging, and so on.
Slice step width – how far the viewer scrolls through each tick of the mouse. The small the value, the slower the scroll and more detail will be viewed.
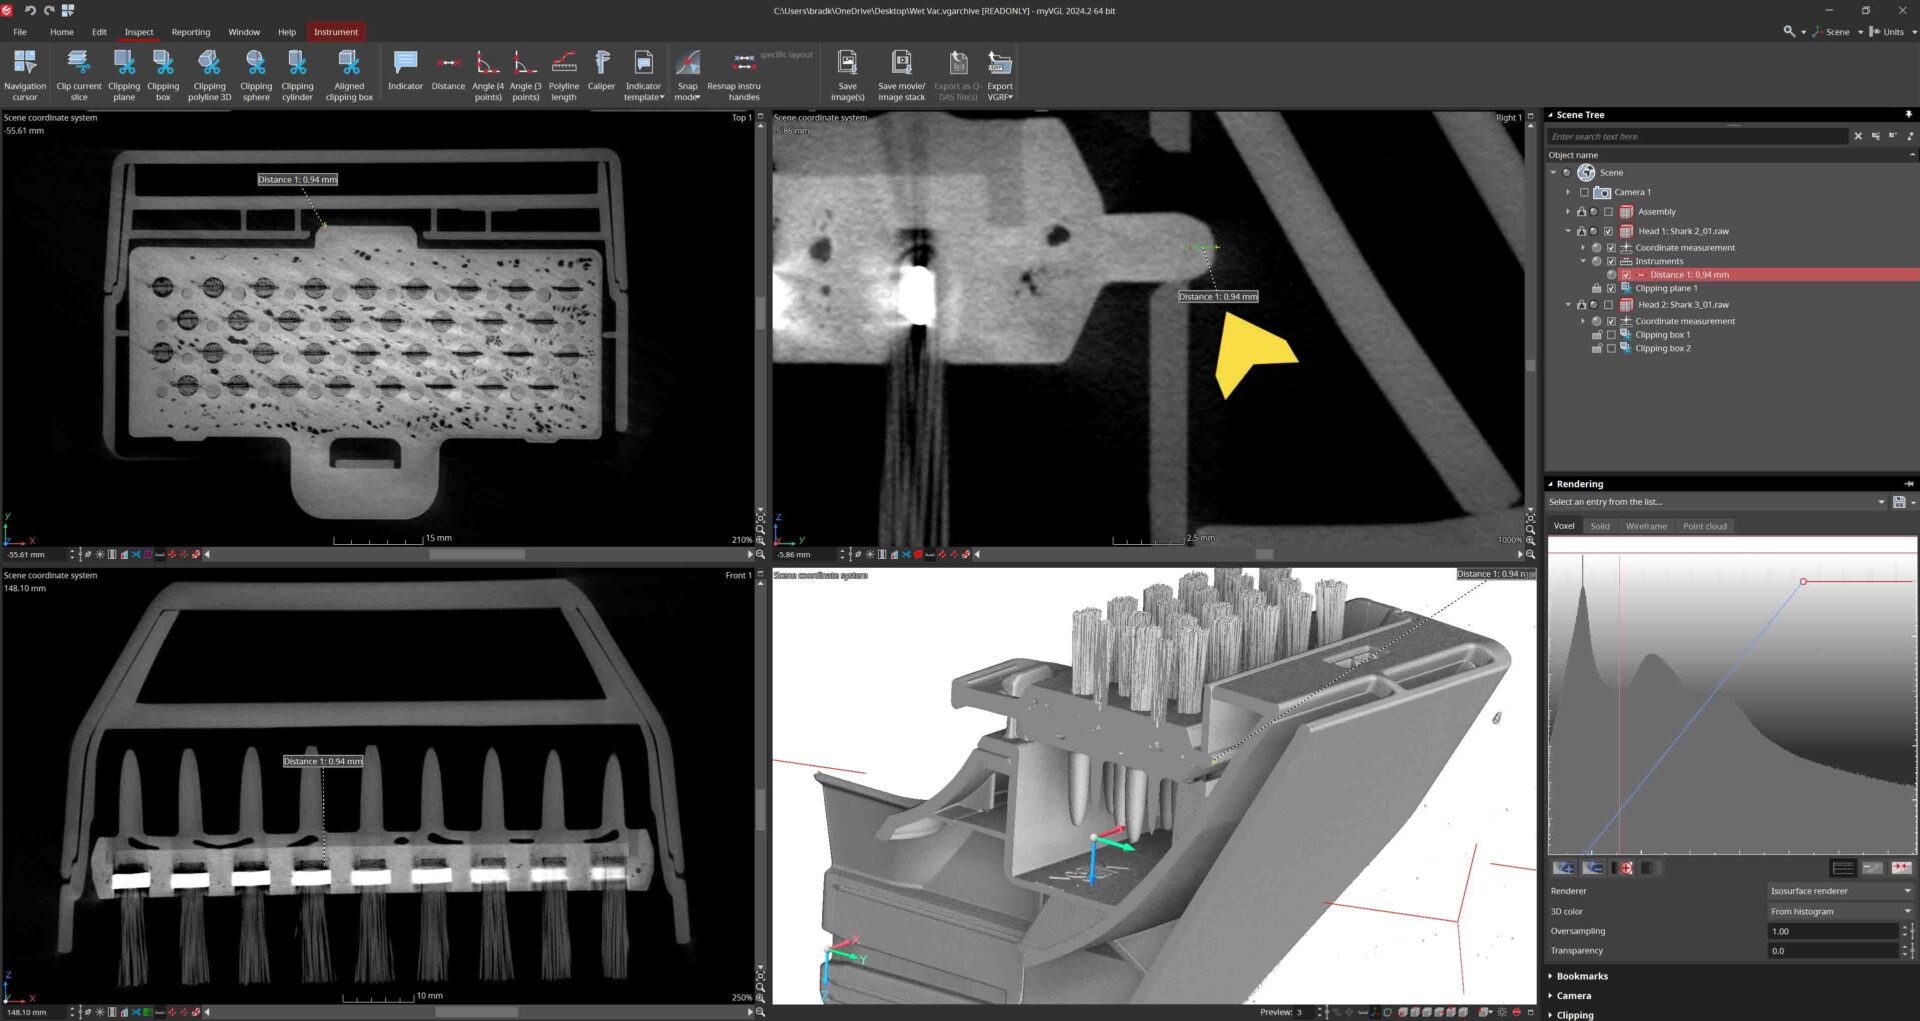
6.MEASUREMENTS
A variety of measurement options are available in myVGL including basic dimensioning like distances, angles, and polylines. However, complex dimensional tools like profiling, wall thickness, CAD alignments, and coordinate systems are reserved for full Volume Graphics Cast & Mold licenses.
Indicators are used to mark areas of interest and recover their locations quickly. Calipers use rendered surface data to create tangible distance measurements.
Clip Depth Measurement
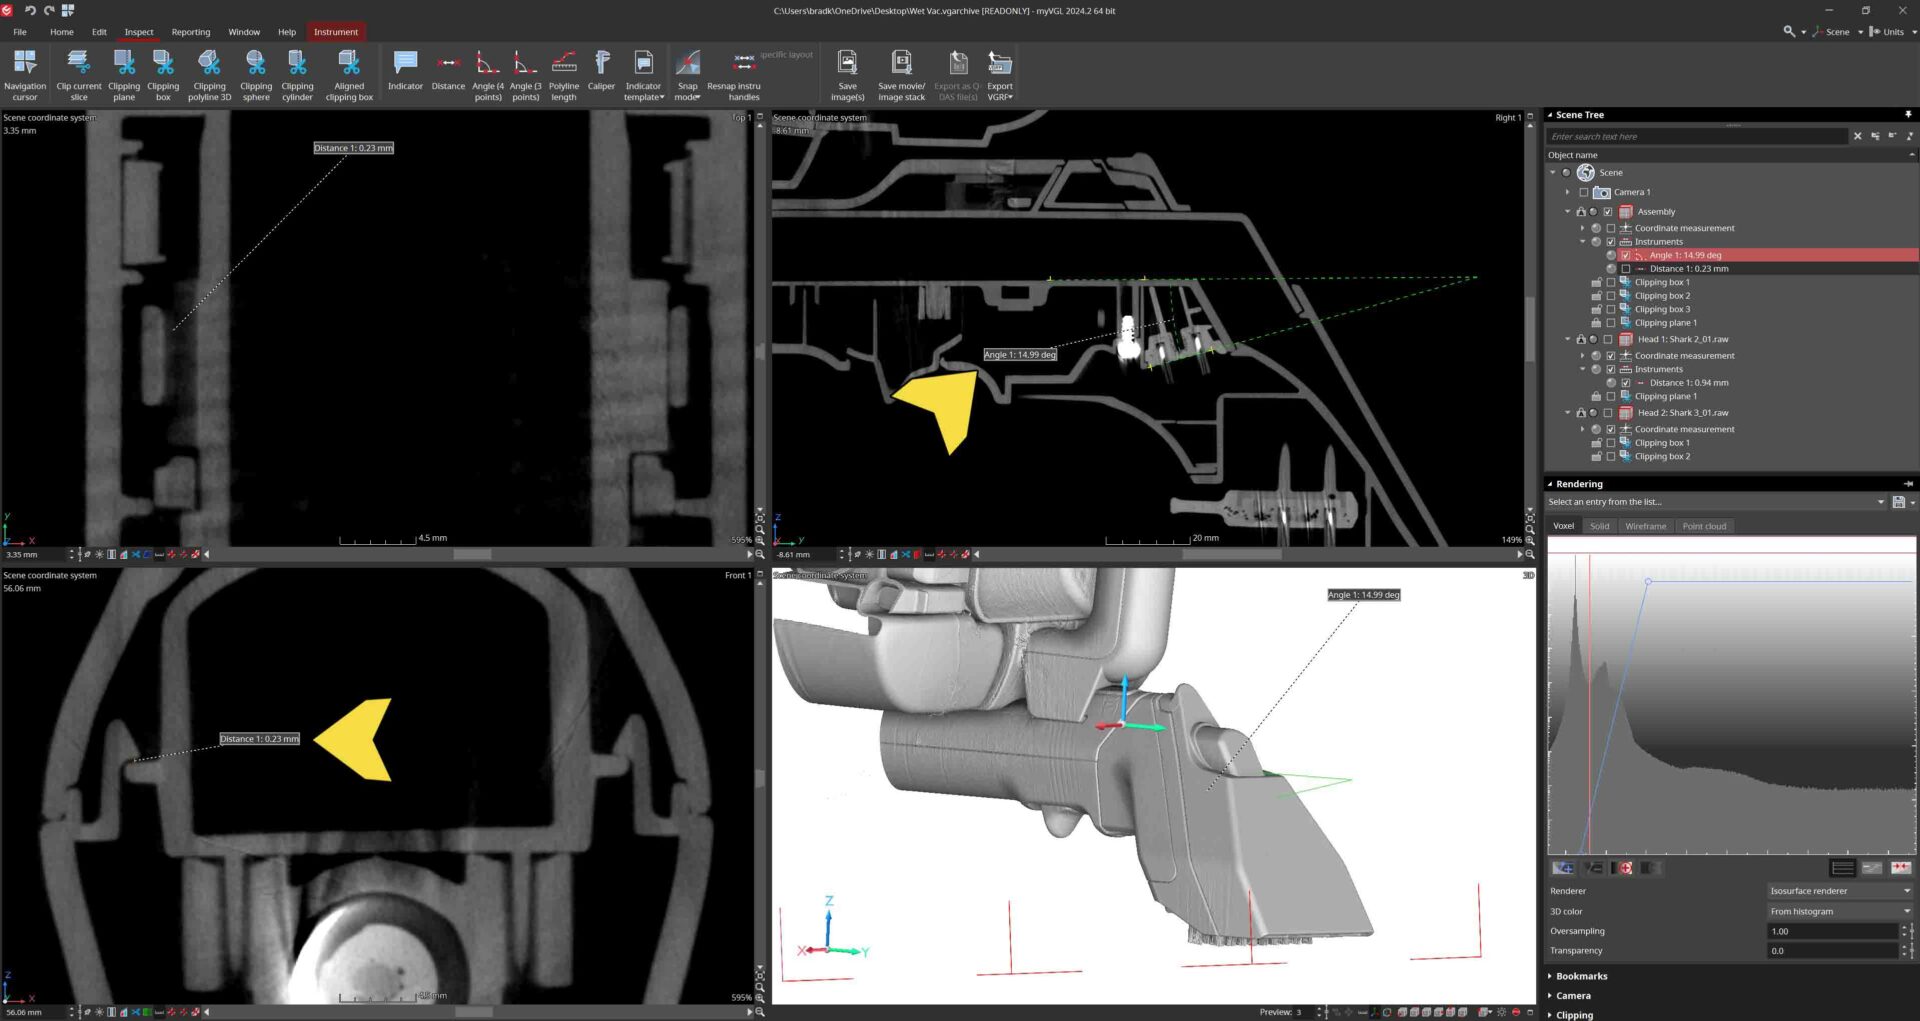
Tube Angle & Clip Gap Measurement
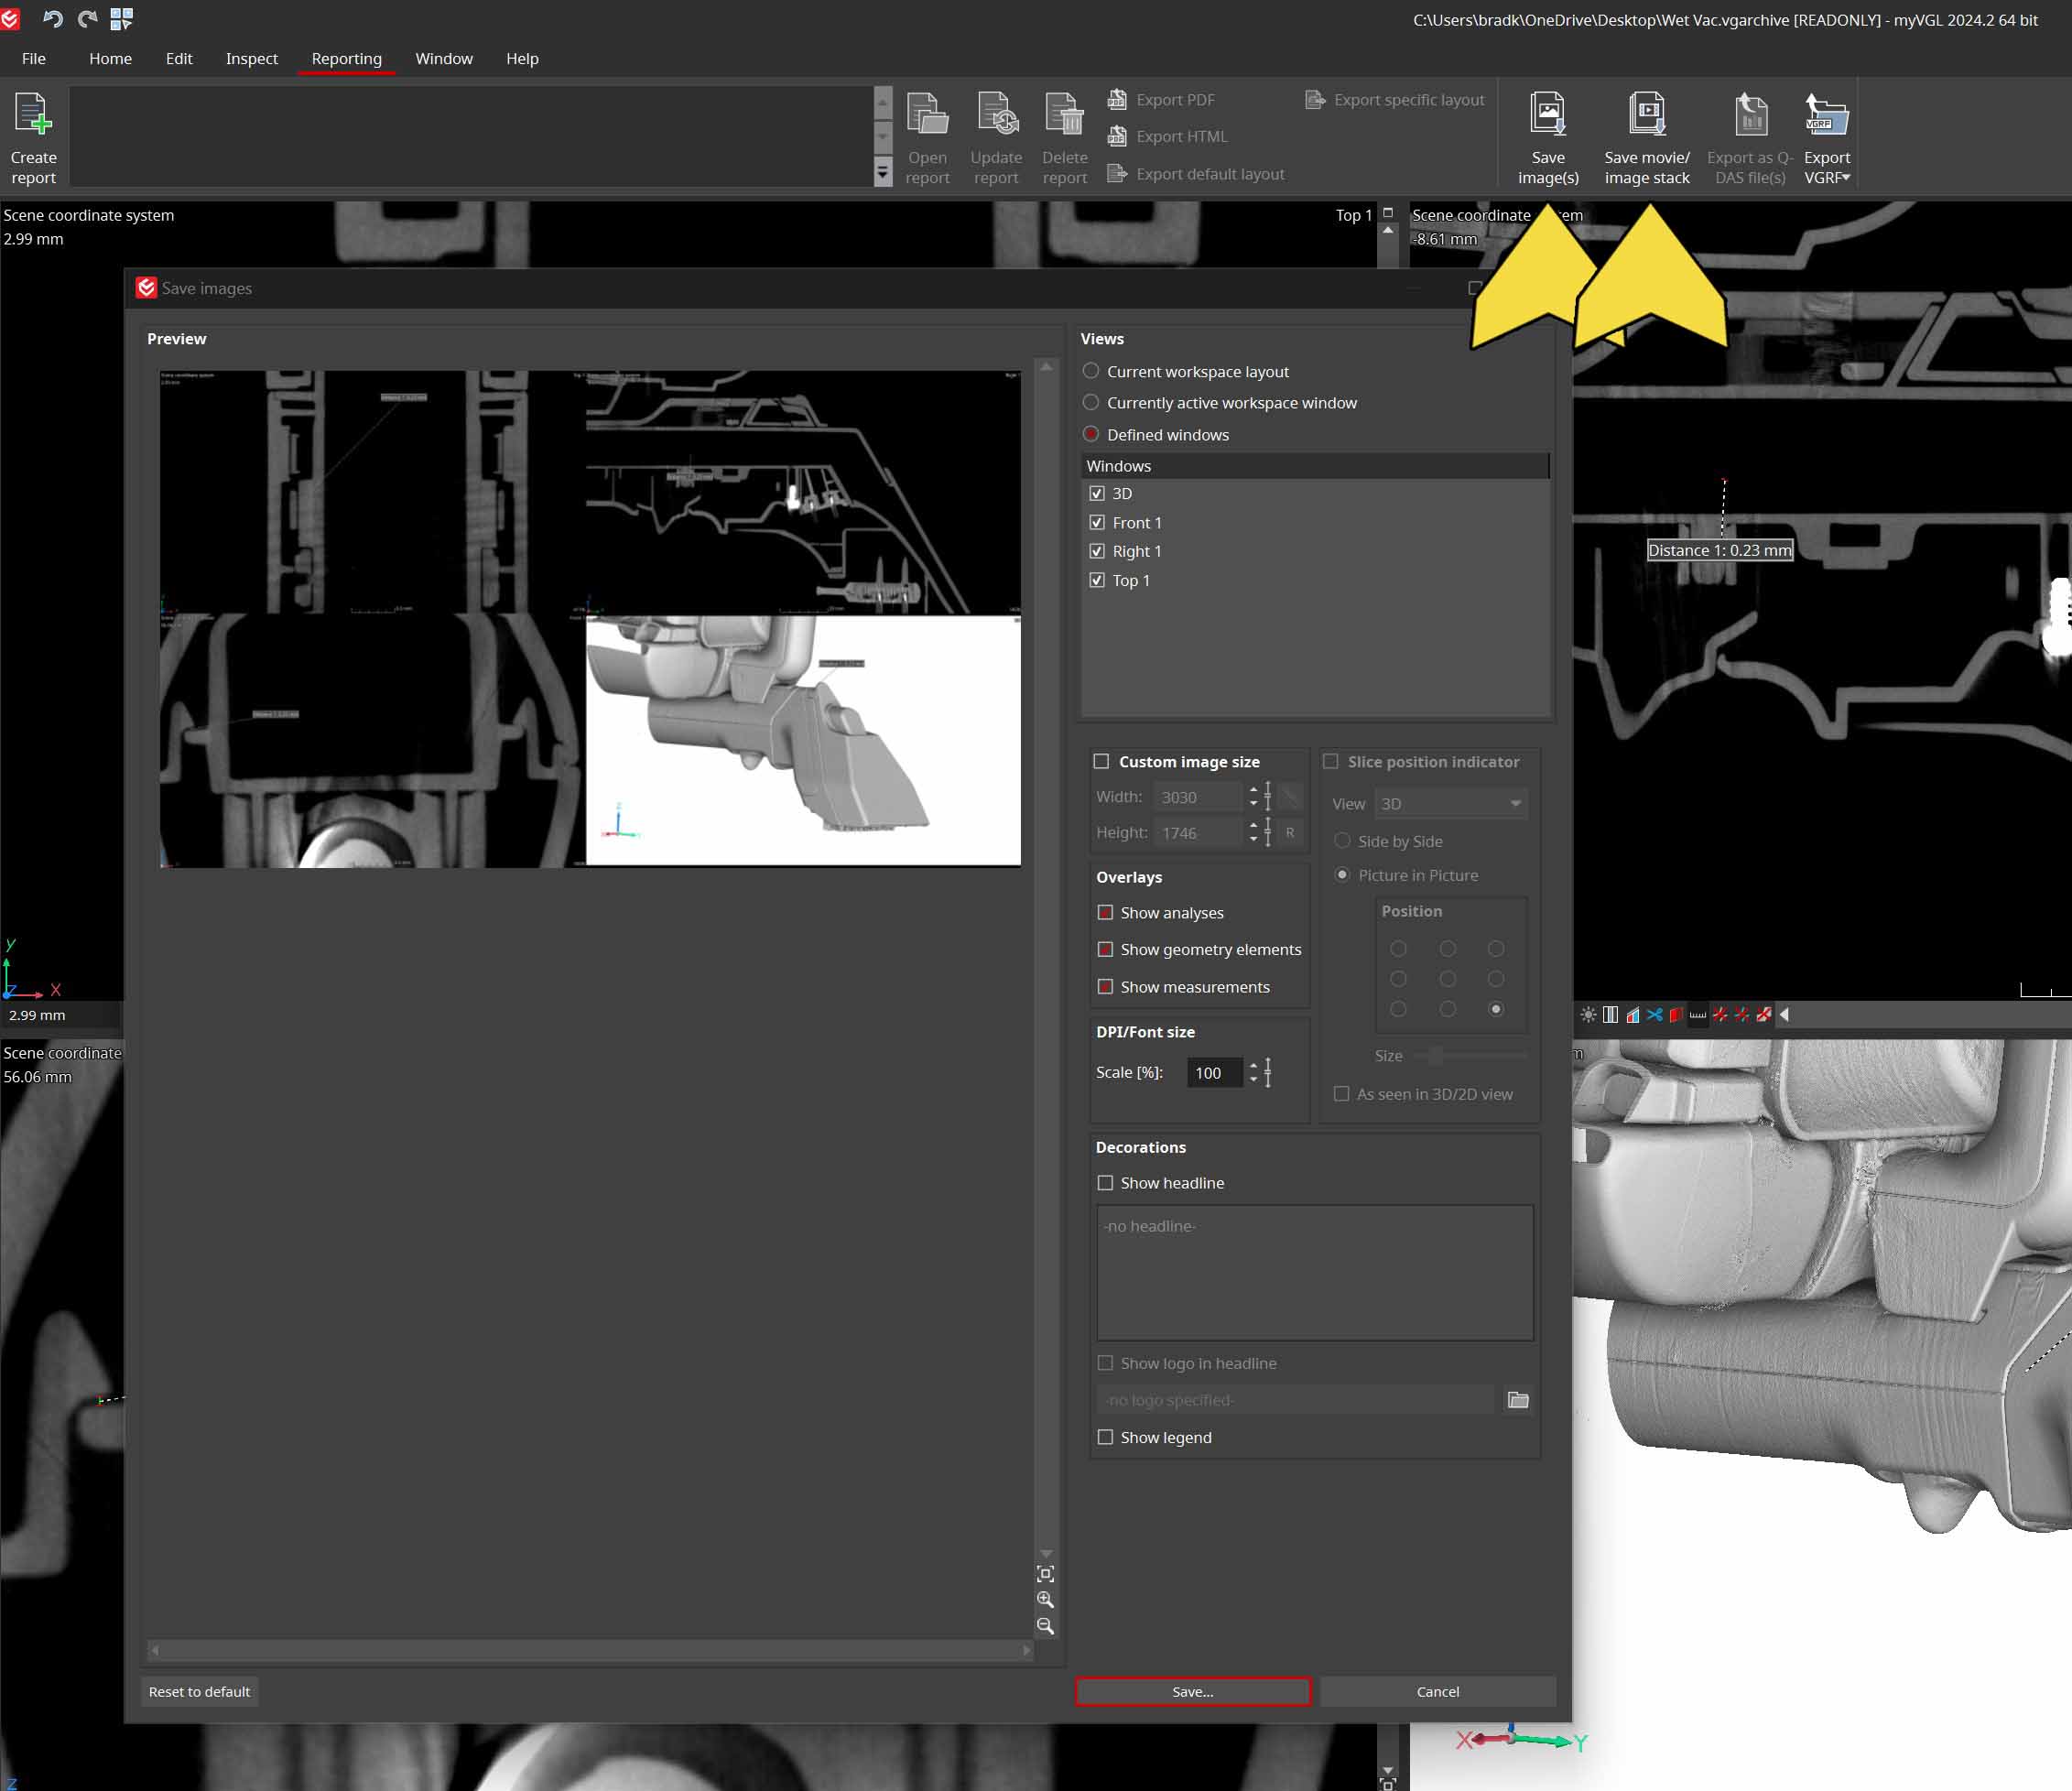
7.IMAGING & REPORTING
In the Reporting panel measurements can be exported to Excel and images can be exported using the Save Image button. Images can be modified based upon the current state of the defined windows of the software or as defined in the Save Image pane.
2D slice videos can also be exported.
8.METROLOGY USING POLYWORKS
Visit our case study about dimensional inspection of these vacuum heads using PolyWorks Metrology Suite here.
Complex dimensional programs can be written for large batches of parts for GD&T and profile analysis.
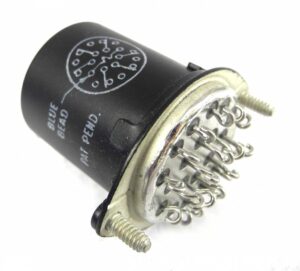
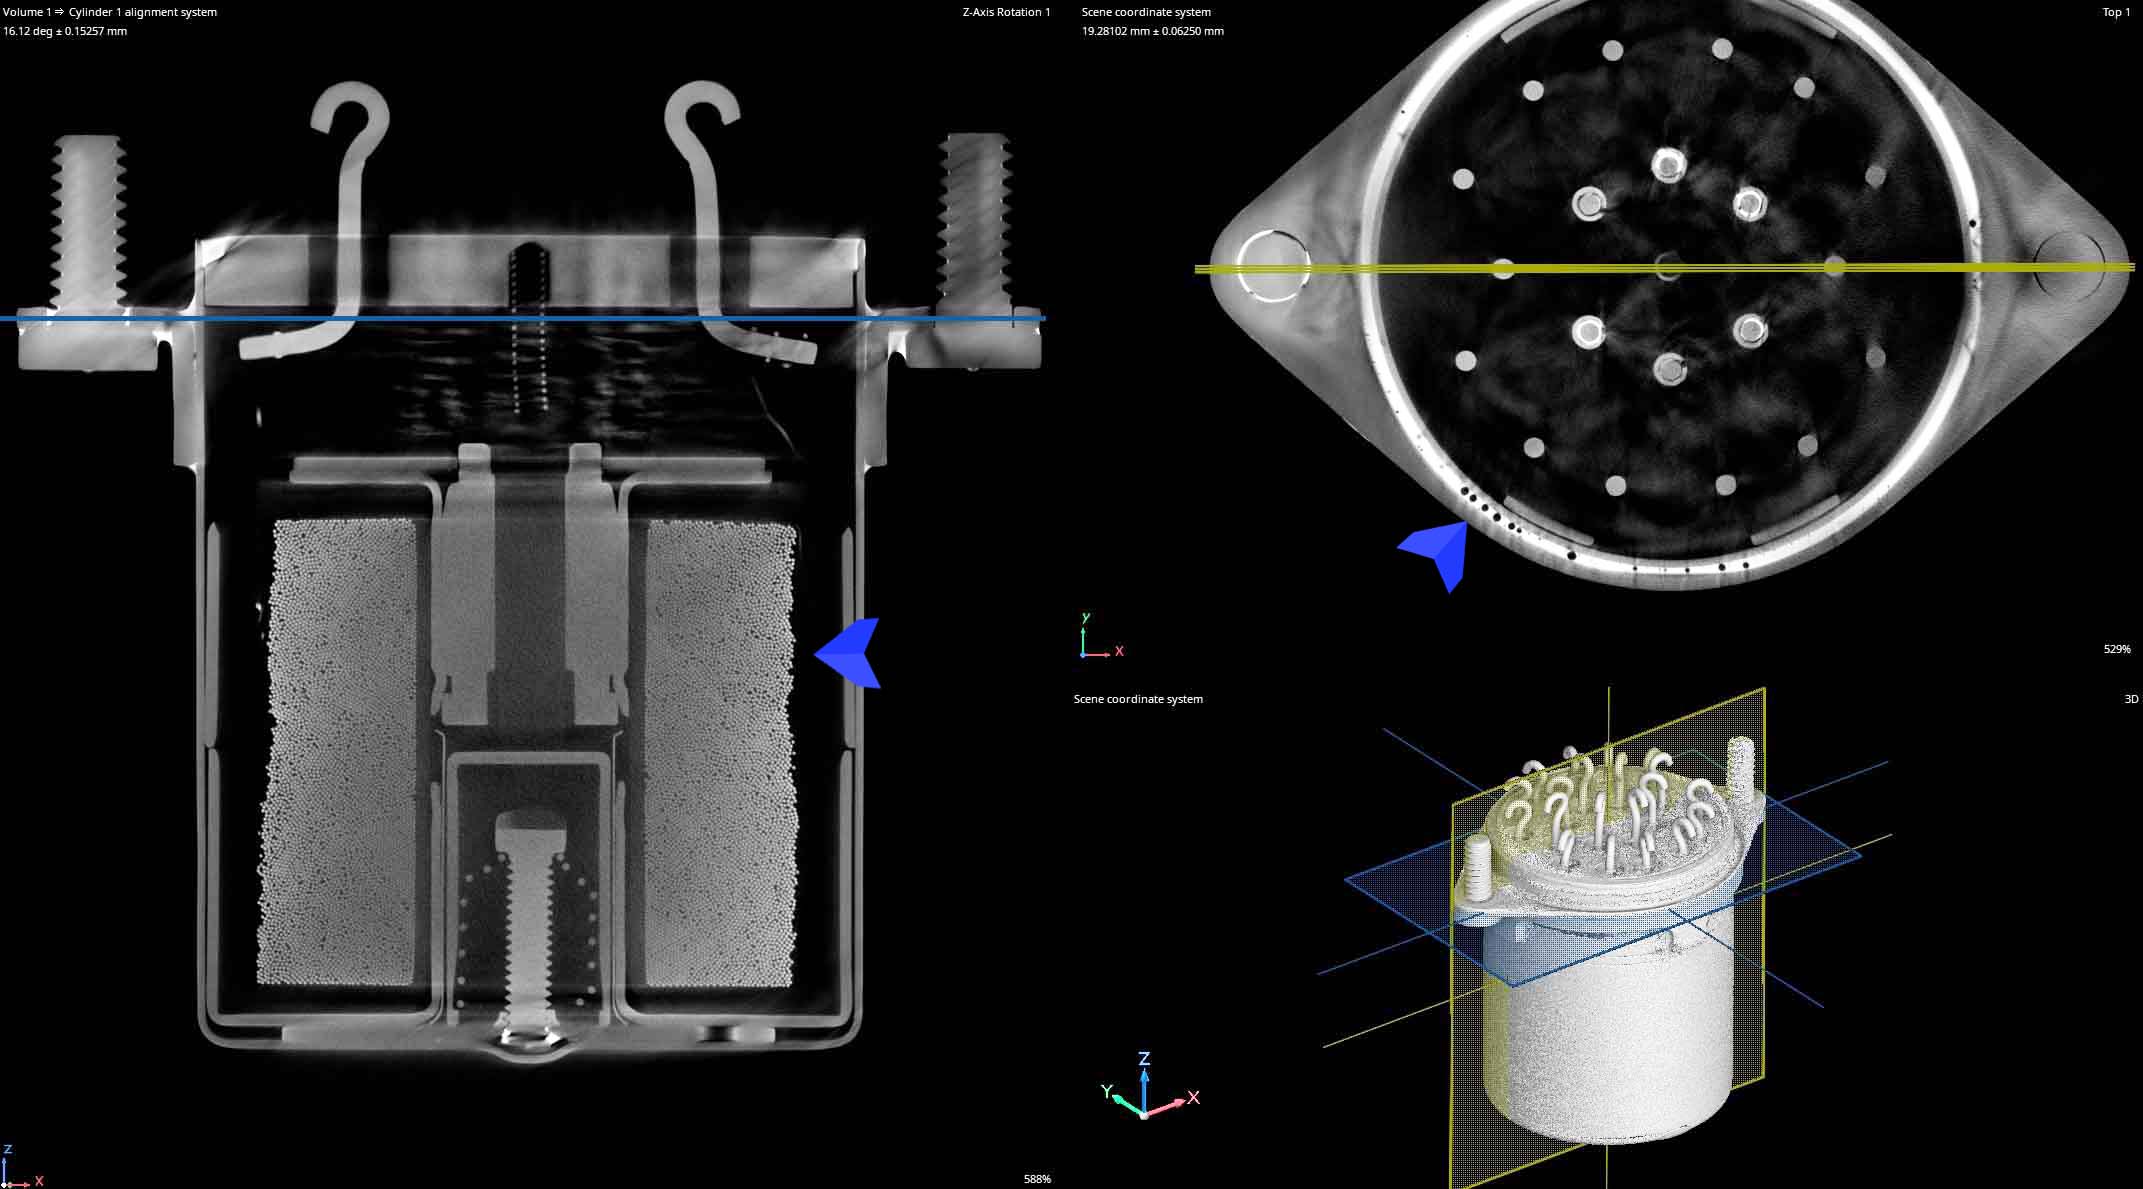
Aviation Relays are used in power distribution systems to control the flow of electrical power to different components and subsystems. Aircraft control systems, such as those for flight control surfaces, landing gear, brakes, and anti-ice systems, often rely on relays to activate and deactivate various functions.
The proper manufacturing of intricate components like these is paramount for the function of each related system it controls. Broken or pinched wires, shorts caused by FOD, and weld quality are all conditions that can be evaluated using Industrial CT Imaging.
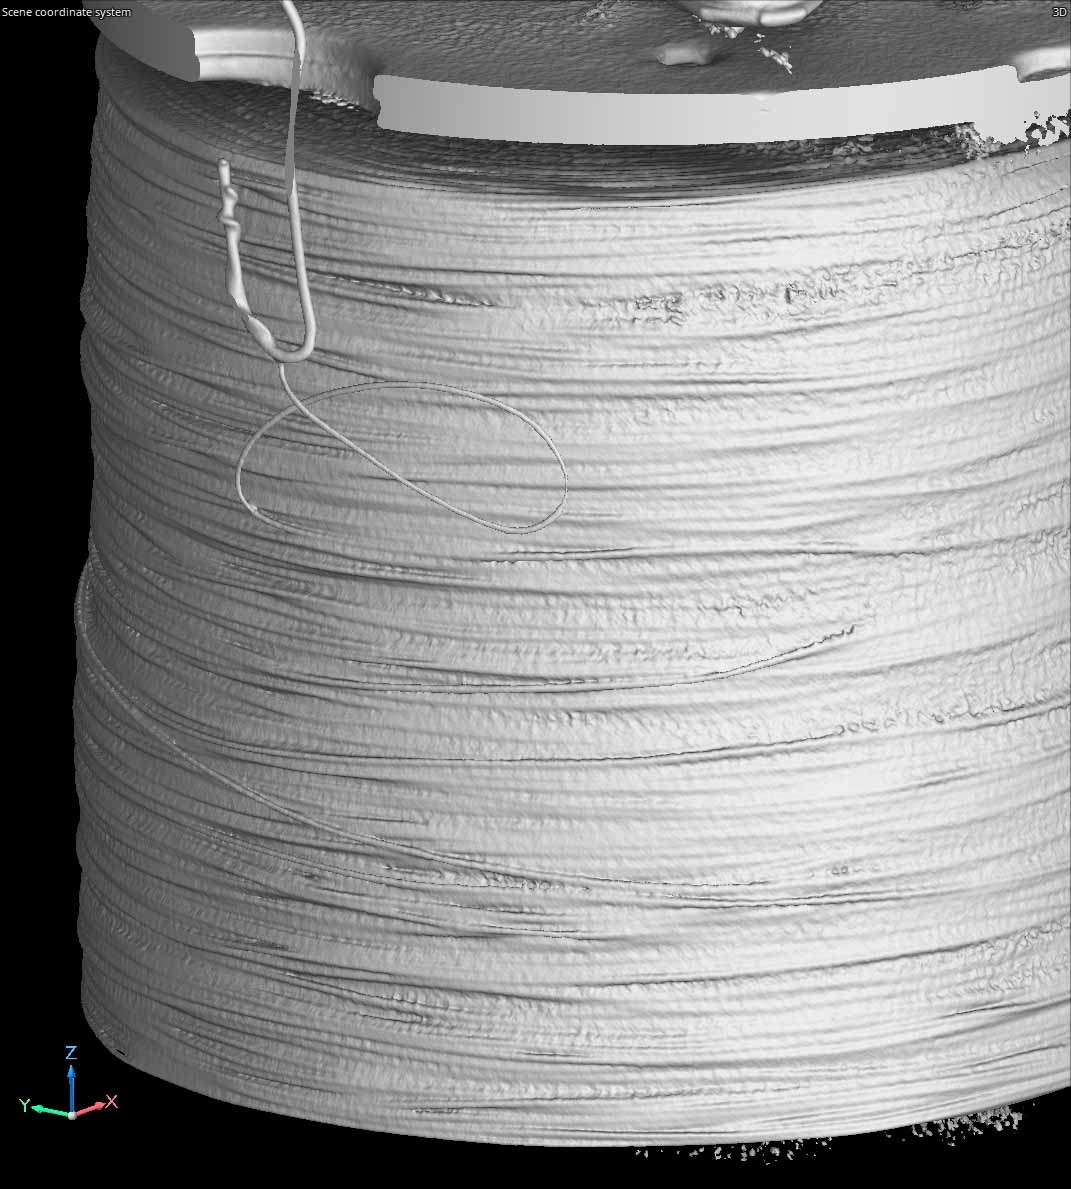
Micro CT scanning offers the ability to render into 3D small geometries like copper windings to look for wire breaks, tang alignments, micro welds, and other geometries. Sometimes, areas of interest are only accessible using 3D characterization via CT scanning because the inspected surfaces are behind high density materials that cannot be adjusted adequately from just a 2D X-Ray perspective.
The oldest fossils are billions of years old. Traditional ways of examining fossils often employ destructive techniques which can compromise these timeless specimens. Industrial computed tomography (CT) scanning offers a non-destructive alternative that enables detailed examination of fossils’ internal and external structures. This case study explores how we can assist the field of paleontology with our microfocus CT scanning capabilities.
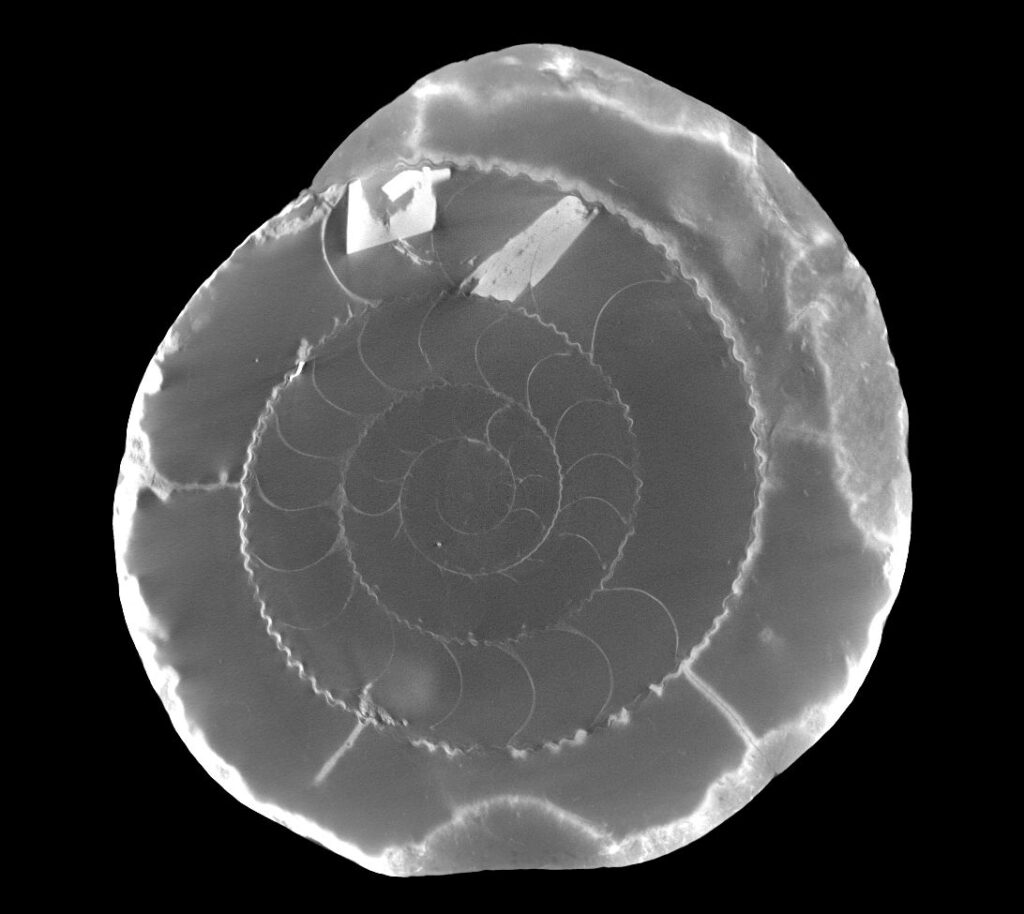
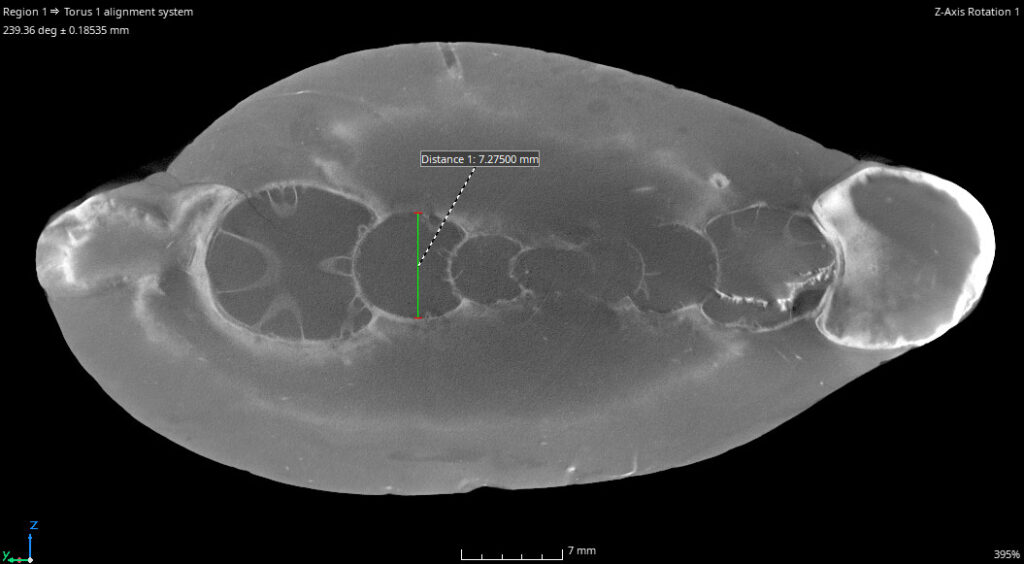
2D Top View of a North Yorkshire Ammonite
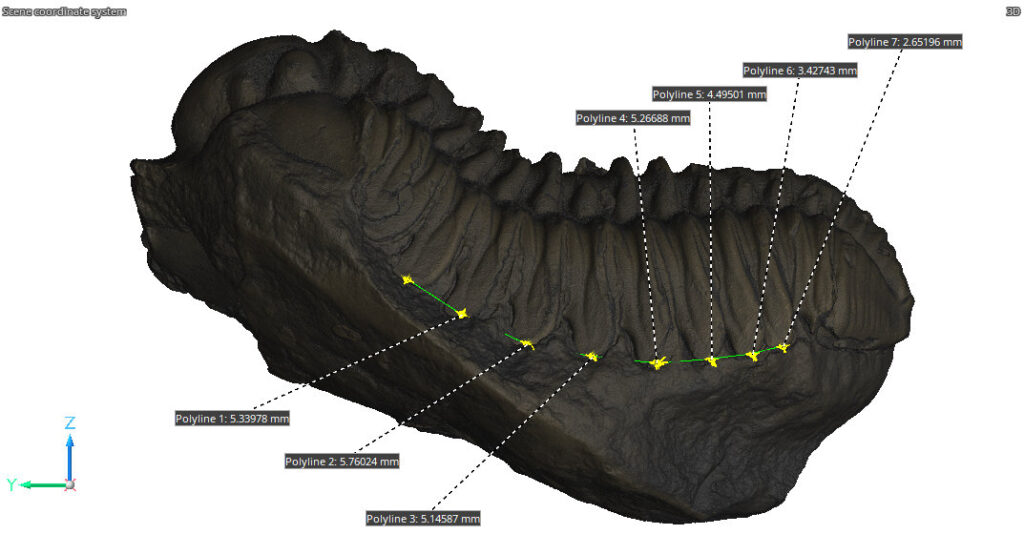
Using 3D CT Model to Reveal Fossilized Trilobite Within a Sedimentary Rock
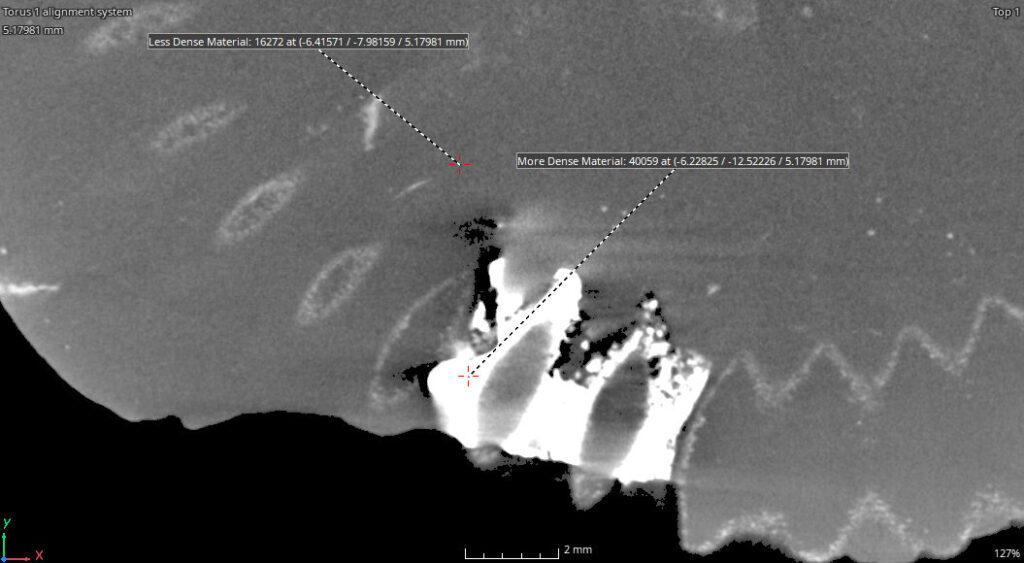
CT technology generates datasets by measuring the differential absorption of x-rays. Changes in material density and thickness cause differences in x-ray attenuation.
Depending on how a fossil was formed, there may be enough difference in material density for x-ray/CT to differentiate fossil from sedimentary rock.
The relative density is dependent on a variety of factors, including the types of minerals present in the fossil, the type of surrounding rock, and the conditions of fossilization. Each fossil and rock pairing can be unique, so the density comparison can vary.
Relative Density Measured by Difference in Grey Scale Values of Low and High Dense Materials
CT generates a 3D model by compiling thousands of 2D x-ray images. This means the 3D model has internal data and we are able to ‘slice’ through the test piece and look at it from any direction.
Using a high-end software for analysis and visualization of our microfocus CT data, we are able to perform a variety of measurements and analysis. We can generate videos for easy viewing and dissemination. We can create .stl models for 3D printing.
And in the case of these ammonites, the best part is we can do all of this analysis while the fossil remains undisturbed within the nodule.
2D Side View of a North Yorkshire Ammonite with Basic Width Measurement
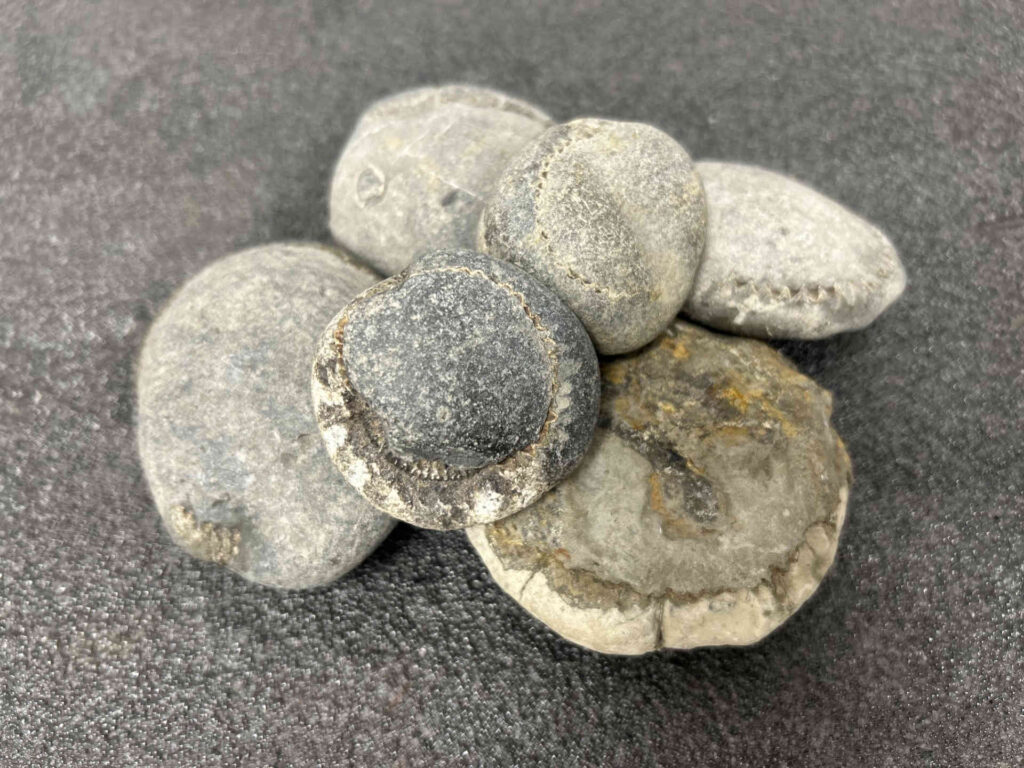
Unbroken North Yorkshire Ammonite Nodules used for this Study
The application of industrial microfocus CT in fossil analysis allows for the detailed examination of internal structures without compromising the integrity of valuable specimens. By providing high-resolution, three-dimensional insights, micro-CT enables us to uncover previously inaccessible information about these ancient organisms. Contact us today to see how we can help with your fossils!
3D Model of a Trilobite - Measuring the Space Between Pleural Spines