Demonstrating CT Scan Parameter Affects on Quality
Demonstrating CT Scan Parameter Affects on Quality
Demonstrating Scan Parameter Quality Differences
This case study seeks to demonstrate CT scan parameters and their effects on data quality. The data focuses on quantity of projections and frame averaging. All parameters remained constant except for a single 20um scan.
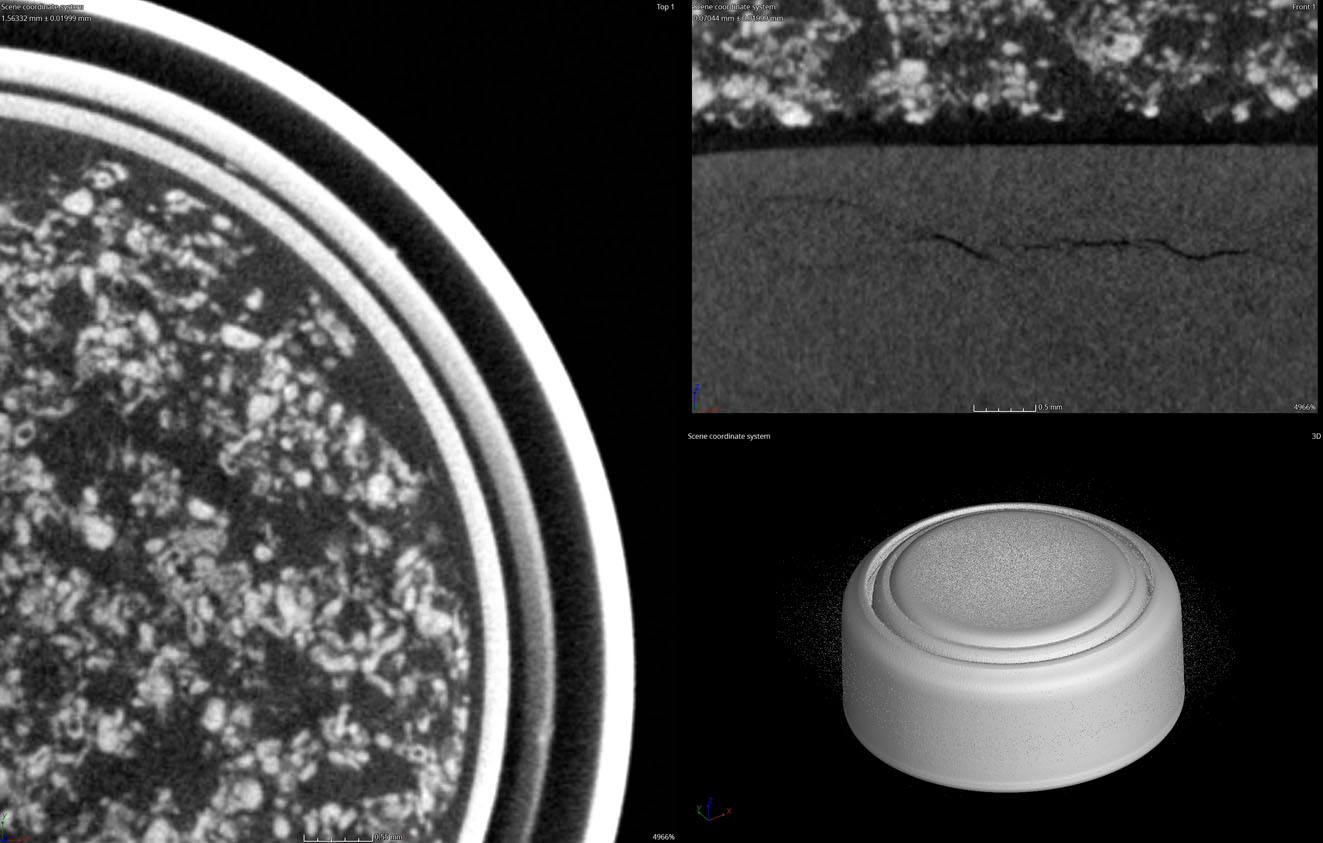
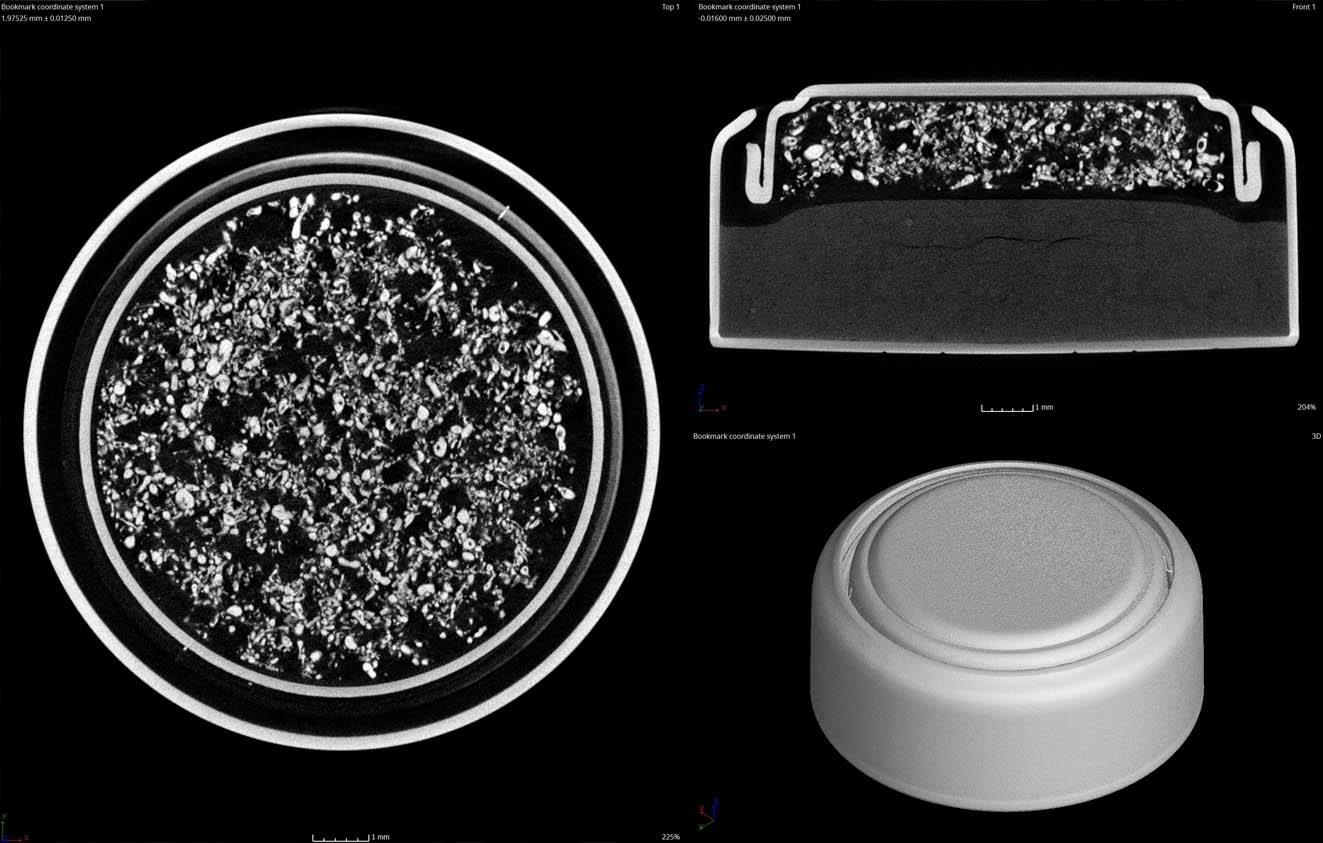
The test sample is a standard button battery which is more complex than it looks with its high density can and low density, fine-featured anode and cathode materials.
PRIMARY CT SCAN PARAMETERS
>Geometric Magnification (Voxel Resolution)
Geometric magnification is defined as the ratio of a test specimen between the x-ray source and detector. If the detector is stationary and the part is moved toward the x-ray source, magnificaiton increases but the field of view decreases. This principle is the most important factor for achieveing high resolution scans.
>>Quantity of X-Ray Projections and Frame Averaging
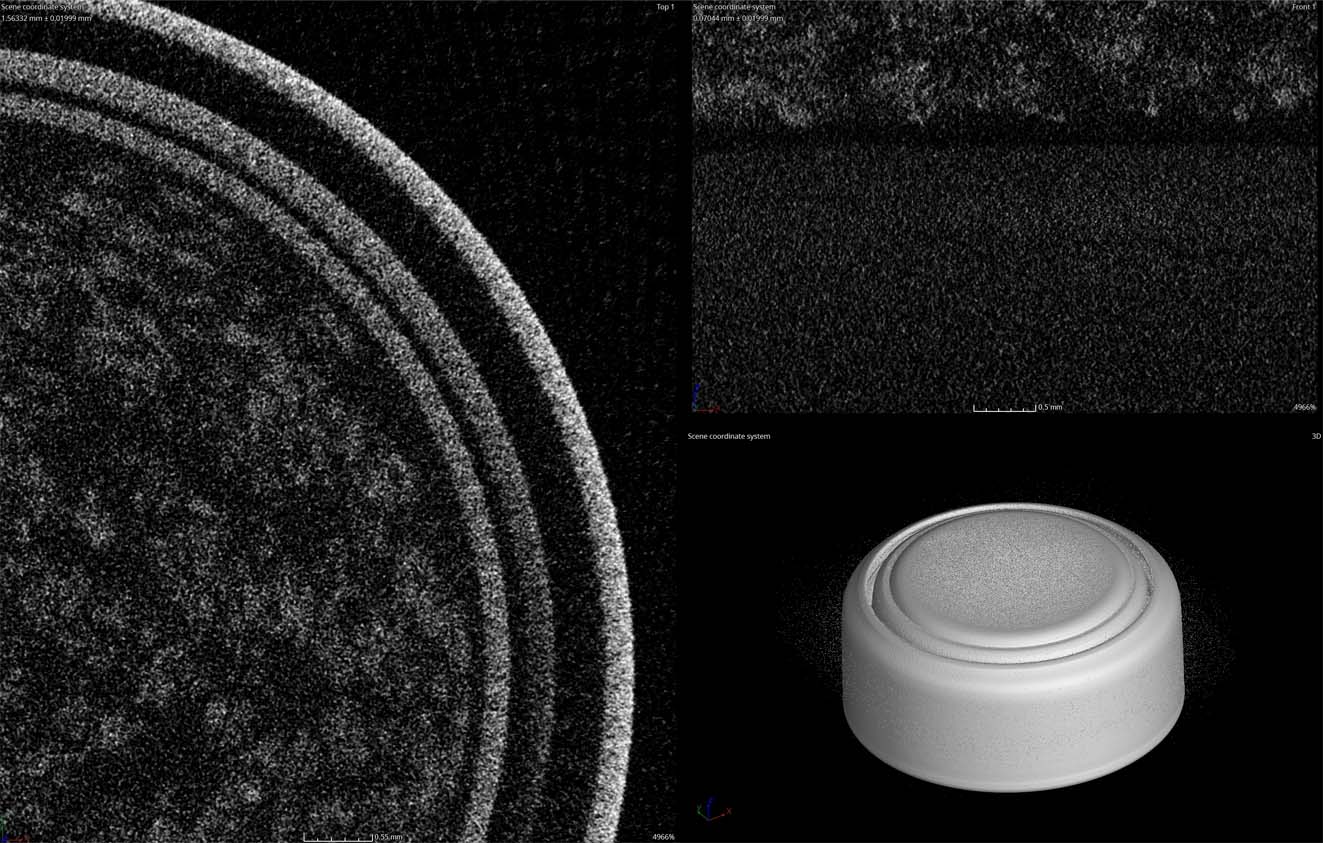
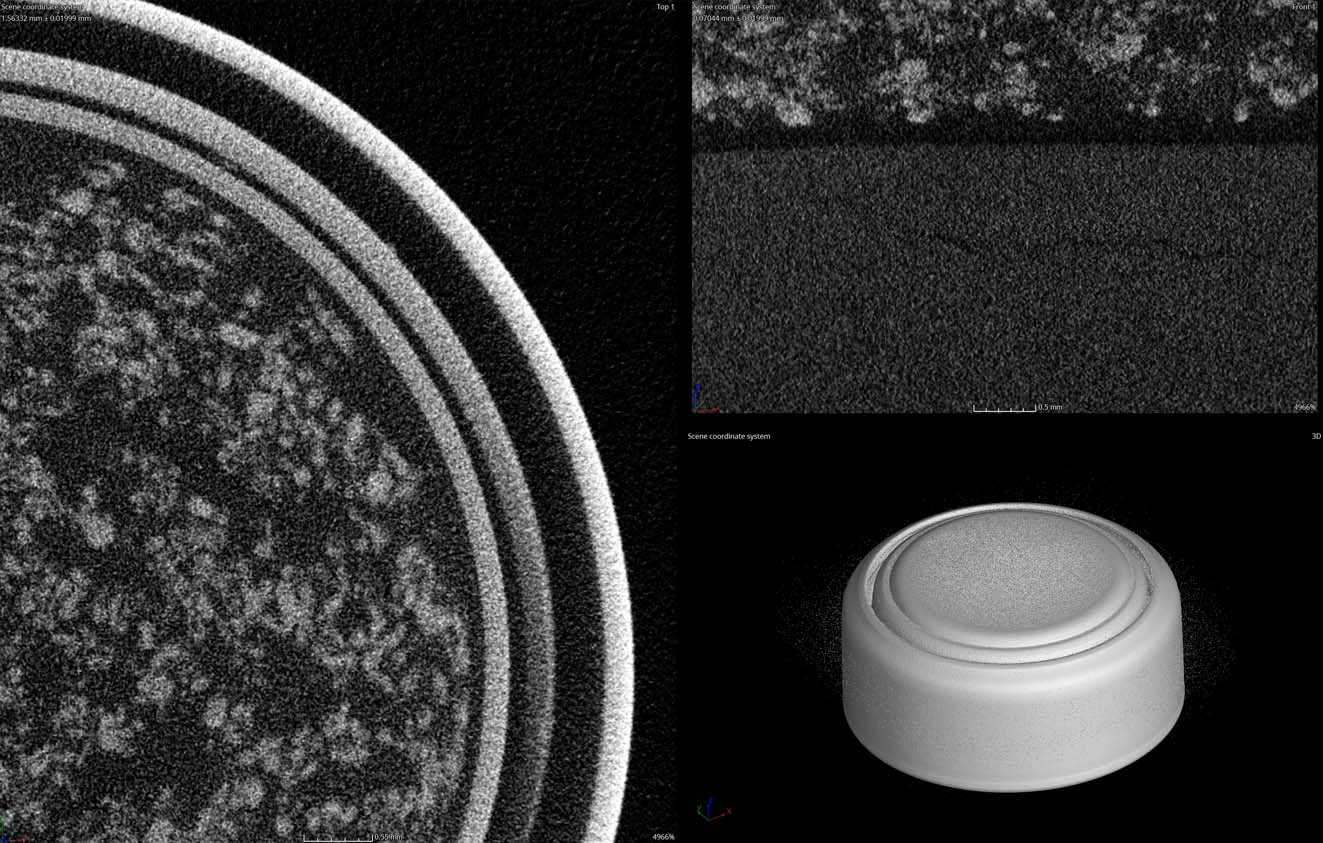
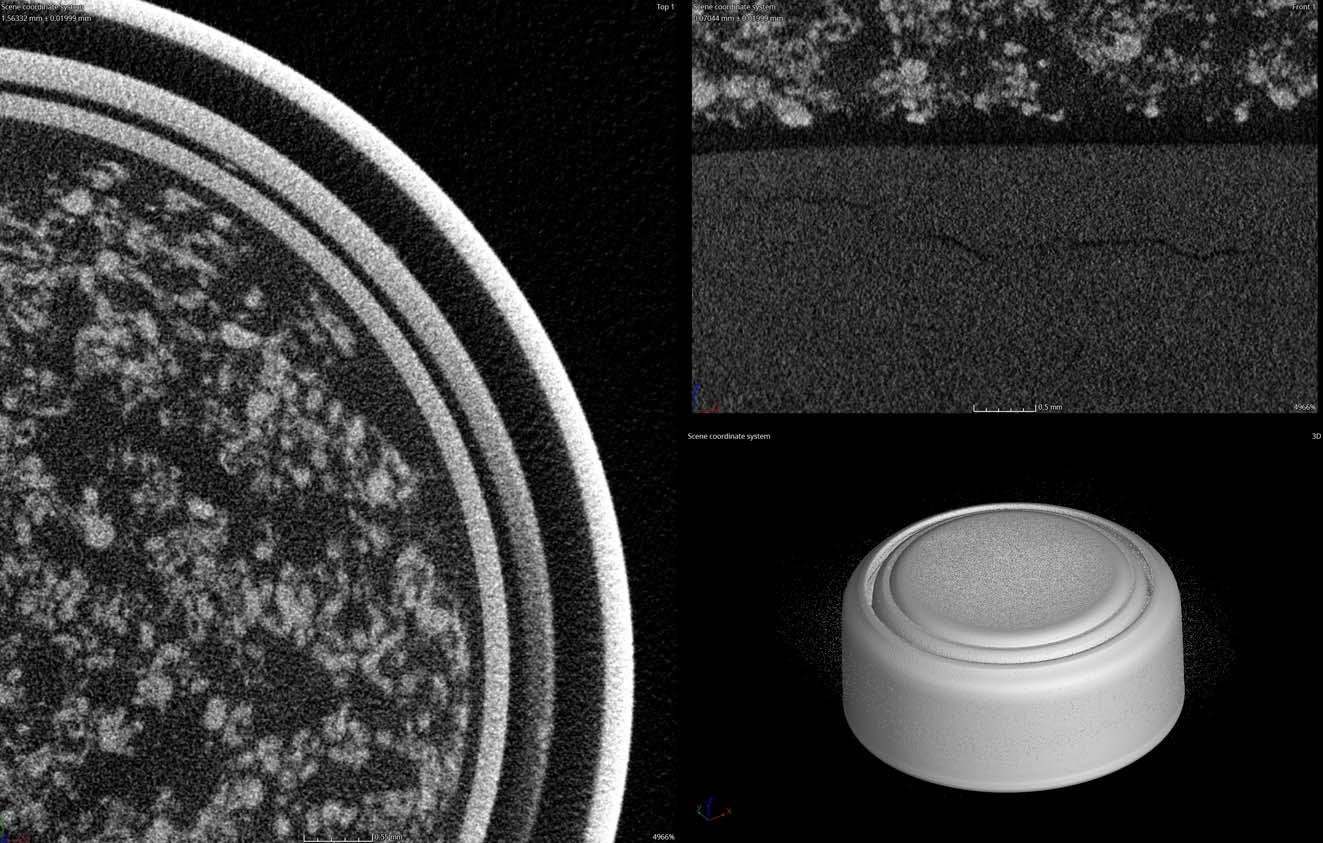
Circular CT scanning produces a cylinder of 3D data. This cylinder is, effectively, a subdivision of x-rays about its axis. The more the cylinder is subdivided (# of projections) the more rich the dataset becomes. Additionally, noise can be reduced by duplicating each projection (frame averaging). There are significant diminishing returns when optimizing these settings.
Electronic parameters significantly impact scan quality. Wattage, or focal spot size, can reduce effective resolution by defocusing the data. Not enough penetrating power (kV) could eliminate the ability to characterize features. High gain brightens an image but does not add meaningful contrast.
>>>>Physical Parameters (Filtration, Part Orientation)
Physical parameters are used to improve data quality. Source side filtration absorbs low energy x-rays, reducing artifacts like scatter. Part orientation is determined on a per-project basis. If an area of interest is specified, staging that area away from other features improves x-ray penetration.
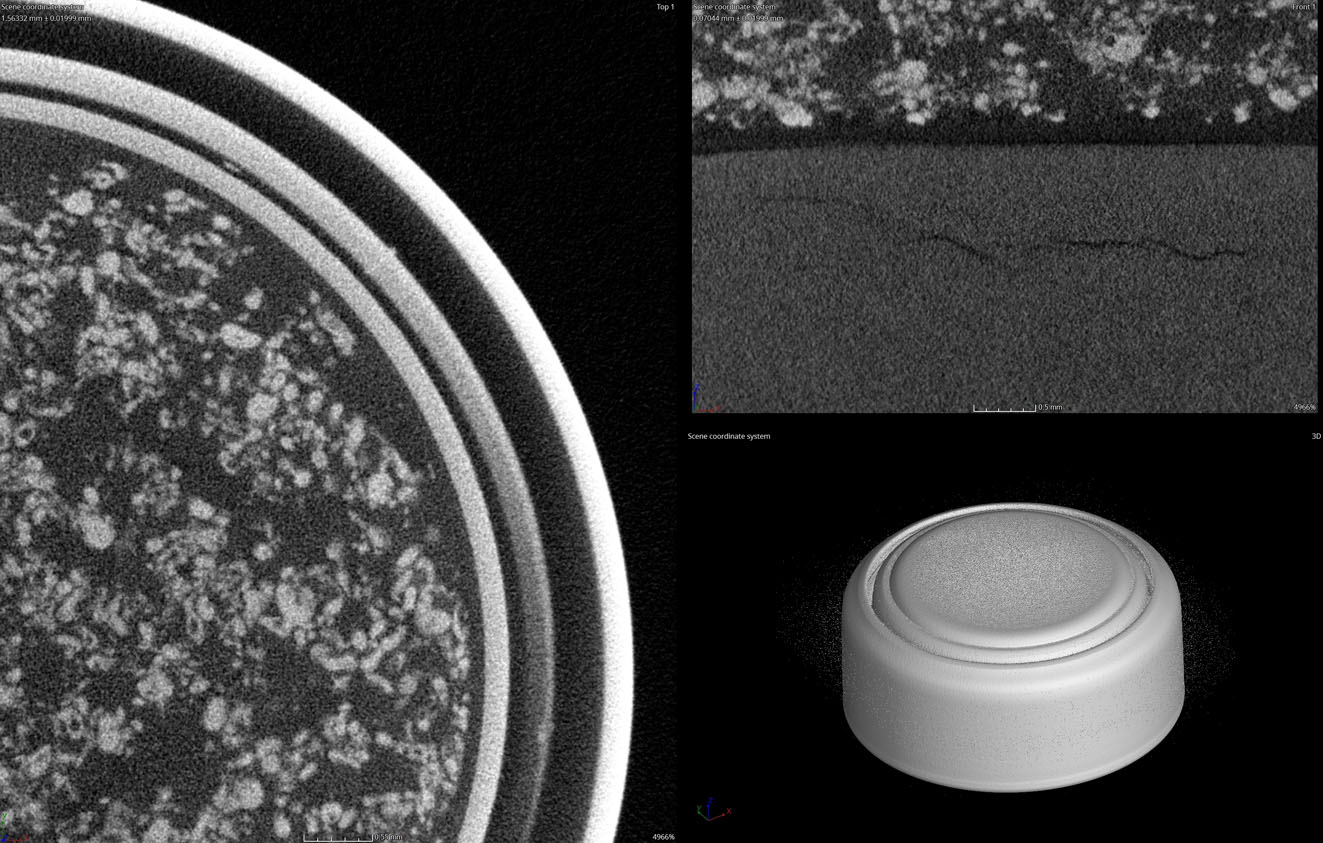
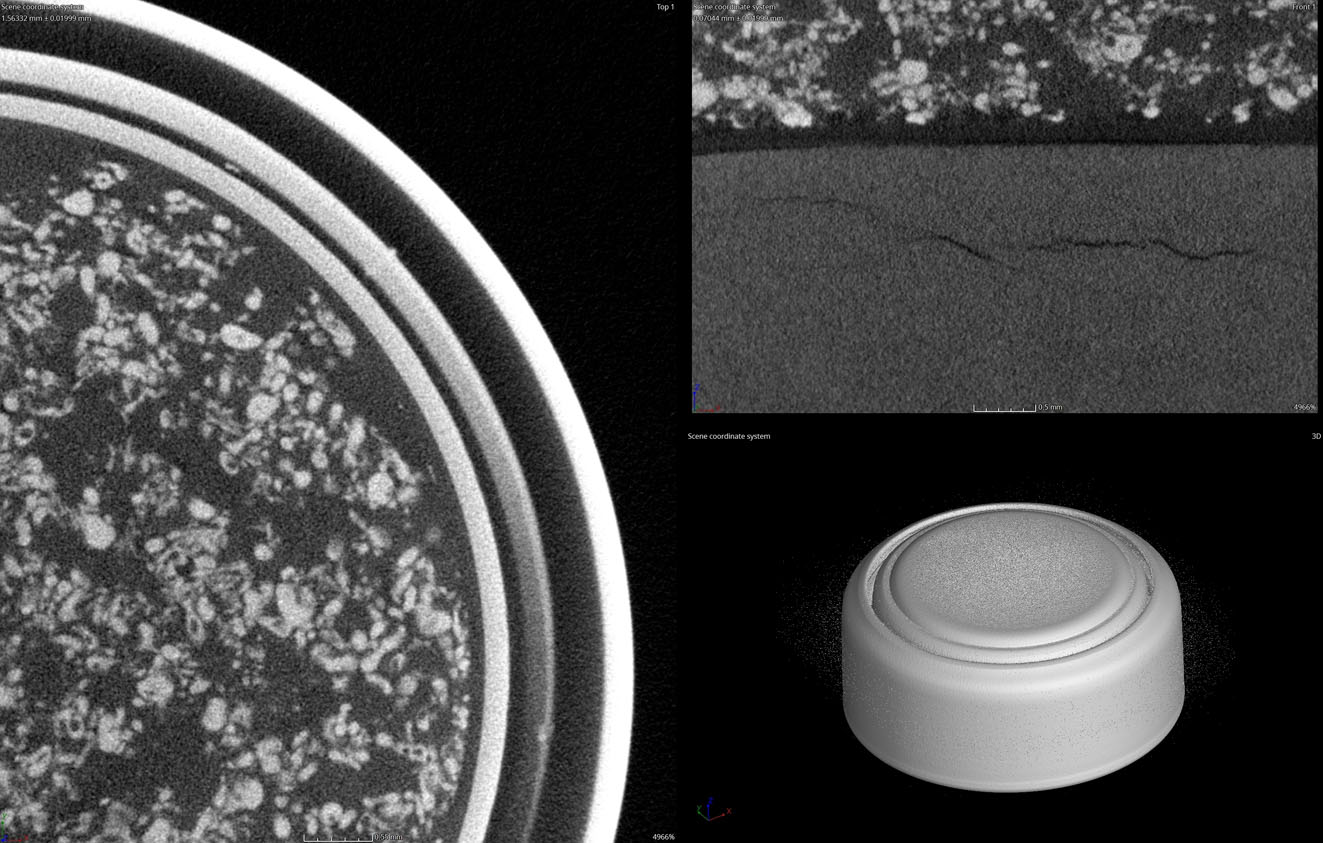
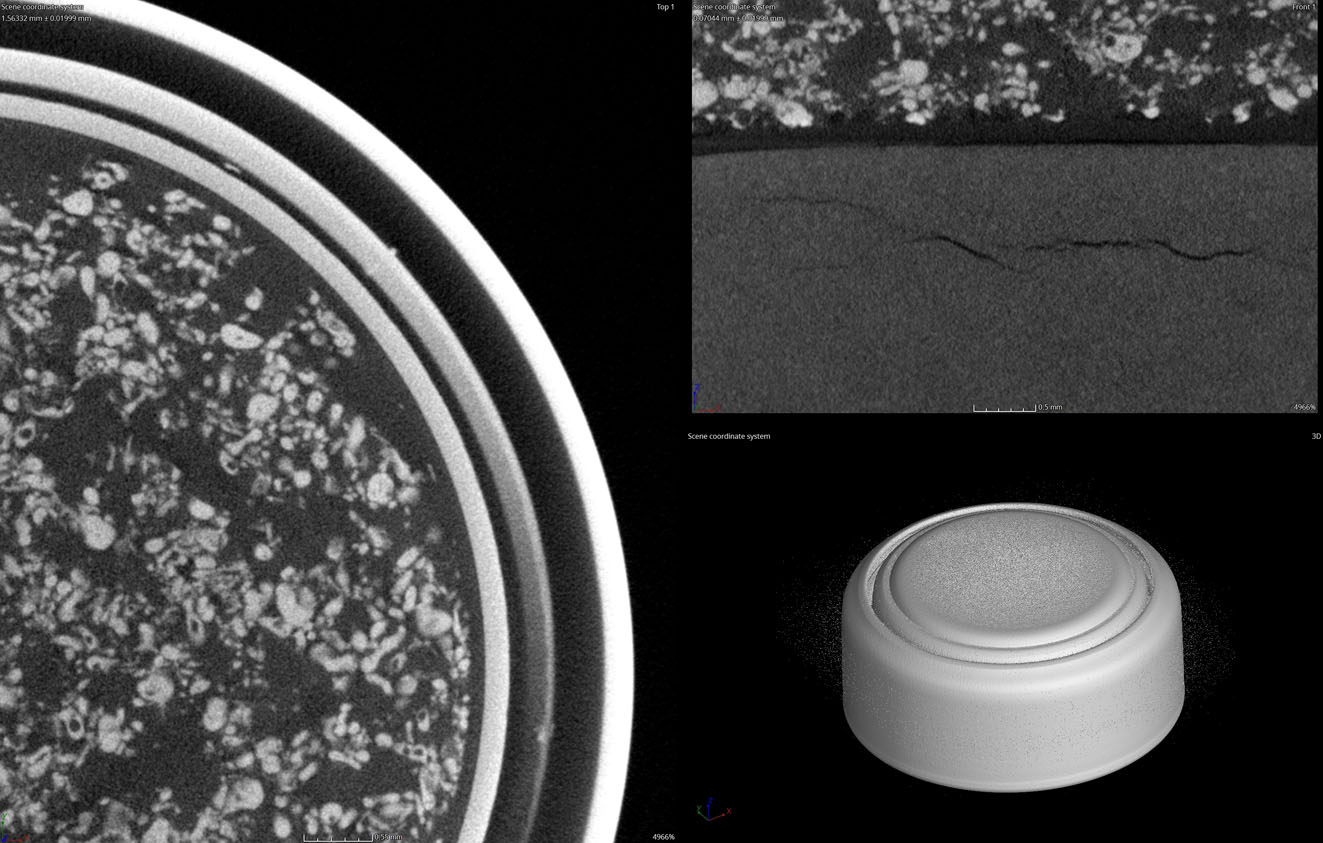
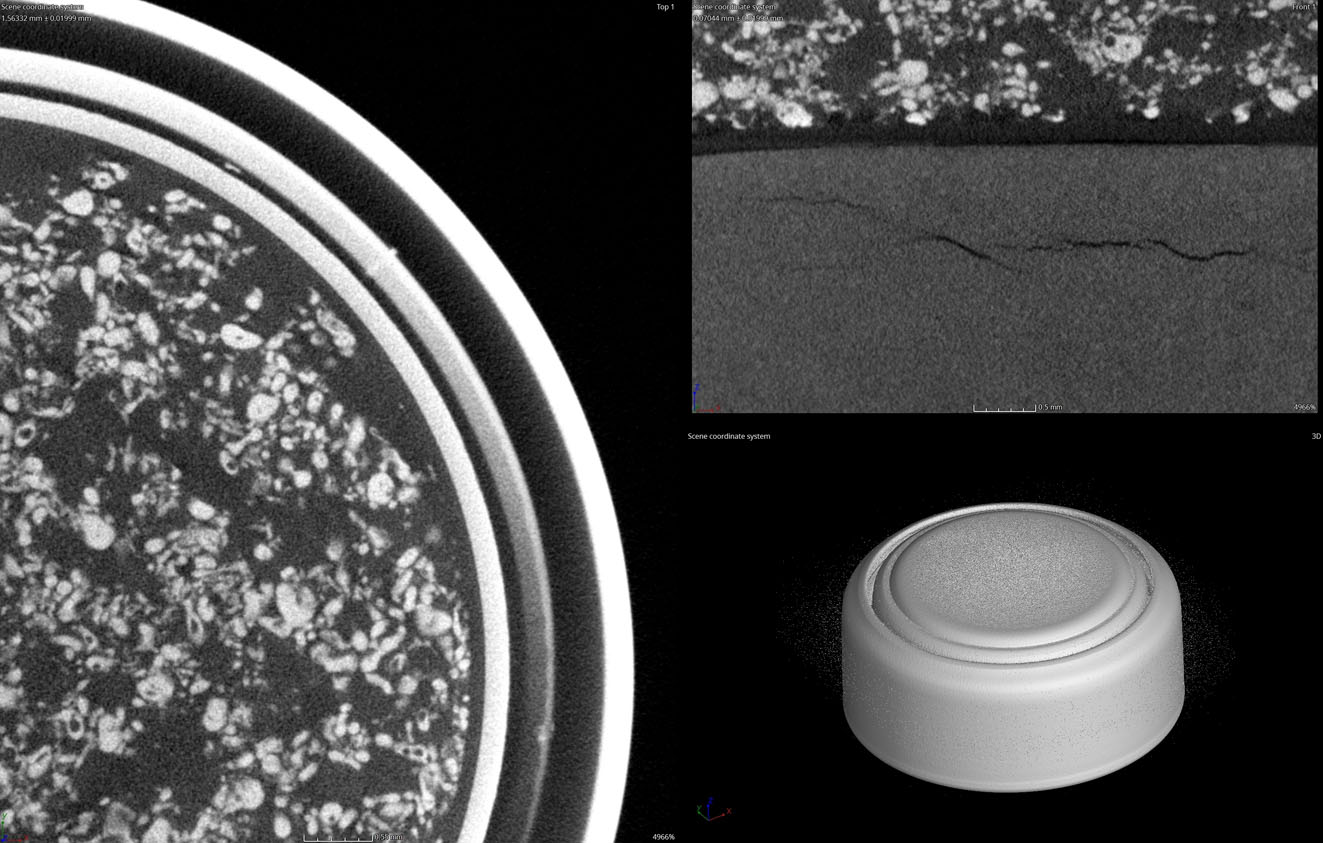
The below tabs demonstrate the quality differences of quantity of projections and frame averaging; all other variables remained constant except the 20um scan. There is a significant difference between even a standard scan and the highest quality. However, this difference must be factored against scan and processing time. Is the highest possible quality necessary for what for what is needing to be learned from the test sample? If it’s not, and there is a large lot of samples to be scanned, optimization of the scan parameters could save significant cost and precious time.
60 Frames
360 Frames
720 Frames
720 Frames, 2x
1440 Frames
2880 Frames
2880 Frames, 2x
5760 Frames
5760 Frames, 2x
5760 Frames, 20um
3141 Frames, Standard
60 Frames
360 Frames
720 Frames
720 Frames, 2x
1440 Frames
2880 Frames
2880 Frames, 2x
5760 Frames
5760 Frames, 2x
5760 Frames, 20um
3141 Frames, Standard
FRAME AVERAGING COMPARISONS
The below tabs demonstrate the quality differences of quantity of projections and frame averaging; all other parameters remained constant. There is a significant difference between even a standard scan and the highest quality. However, this difference must be factored against scan and processing time. Is the highest possible quality necessary for what for what is needing to be learned from the test sample? If it’s not, and there is a large lot of samples to be scanned, optimization of the scan parameters could save significant cost and precious time.
The content below is best viewed on desktop with 3x as many examples.